QUESTION IMAGE
Question
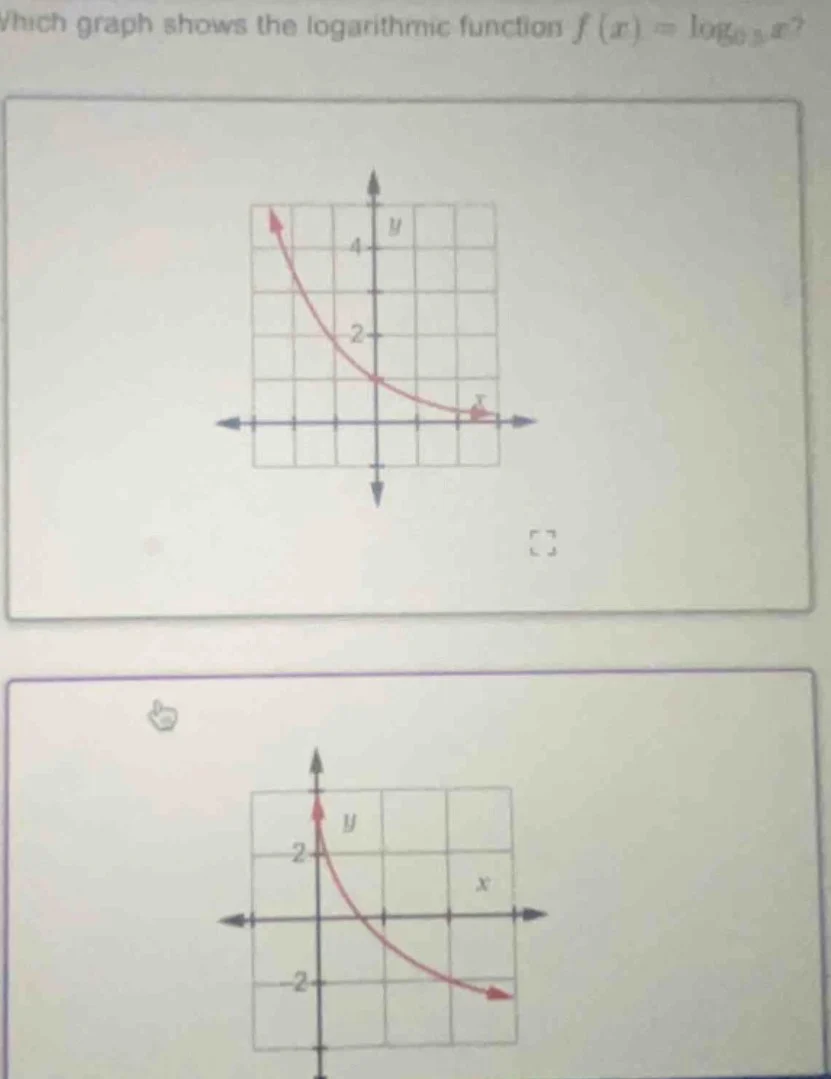
which graph shows the logarithmic function $f(x)=\log_{0.5}x$?
Step1: Analyze base of log function
For $f(x)=\log_{a}x$, if $0 The x-intercept occurs when $f(x)=0$. Solve $\log_{0.5}x=0$. By log definition, $x=0.5^0=1$. So the graph passes through $(1,0)$. Calculate $f(0.5)=\log_{0.5}0.5=1$. So the graph passes through $(0.5,1)$. The top graph passes through $(1,0)$ and $(0.5,1)$, fits the function's properties. The bottom graph passes through $(0,2)$, which is invalid since $\log_{0.5}x$ is undefined at $x=0$.Step2: Find x-intercept of the function
Step3: Check y-value at x=0.5
Step4: Match points to given graphs

Snap & solve any problem in the app
Get step-by-step solutions on Sovi AI
Photo-based solutions with guided steps
Explore more problems and detailed explanations
The top graph (the first one shown) represents the function $f(x)=\log_{0.5}x$.