QUESTION IMAGE
Question
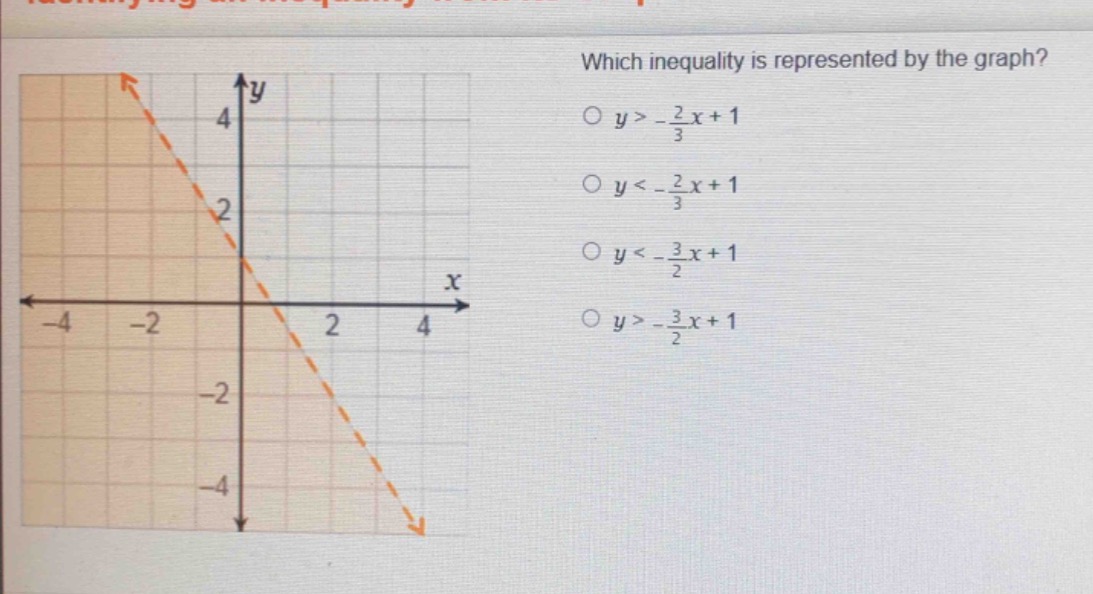
which inequality is represented by the graph?
$\circ$ $y > -\frac{2}{3}x + 1$
$\circ$ $y < -\frac{2}{3}x + 1$
$\circ$ $y < -\frac{3}{2}x + 1$
$\circ$ $y > -\frac{3}{2}x + 1$
Step1: Find line slope
Using points (0,1) and (3,-1):
$$m=\frac{-1-1}{3-0}=-\frac{2}{3}$$
Step2: Identify line equation
Y-intercept is 1, so:
$$y=-\frac{2}{3}x+1$$
Step3: Determine inequality sign
Dashed line, shaded left (greater y):
$$y > -\frac{2}{3}x+1$$

Snap & solve any problem in the app
Get step-by-step solutions on Sovi AI
Photo-based solutions with guided steps
Explore more problems and detailed explanations
A. $y > -\frac{2}{3}x+1$