QUESTION IMAGE
Question
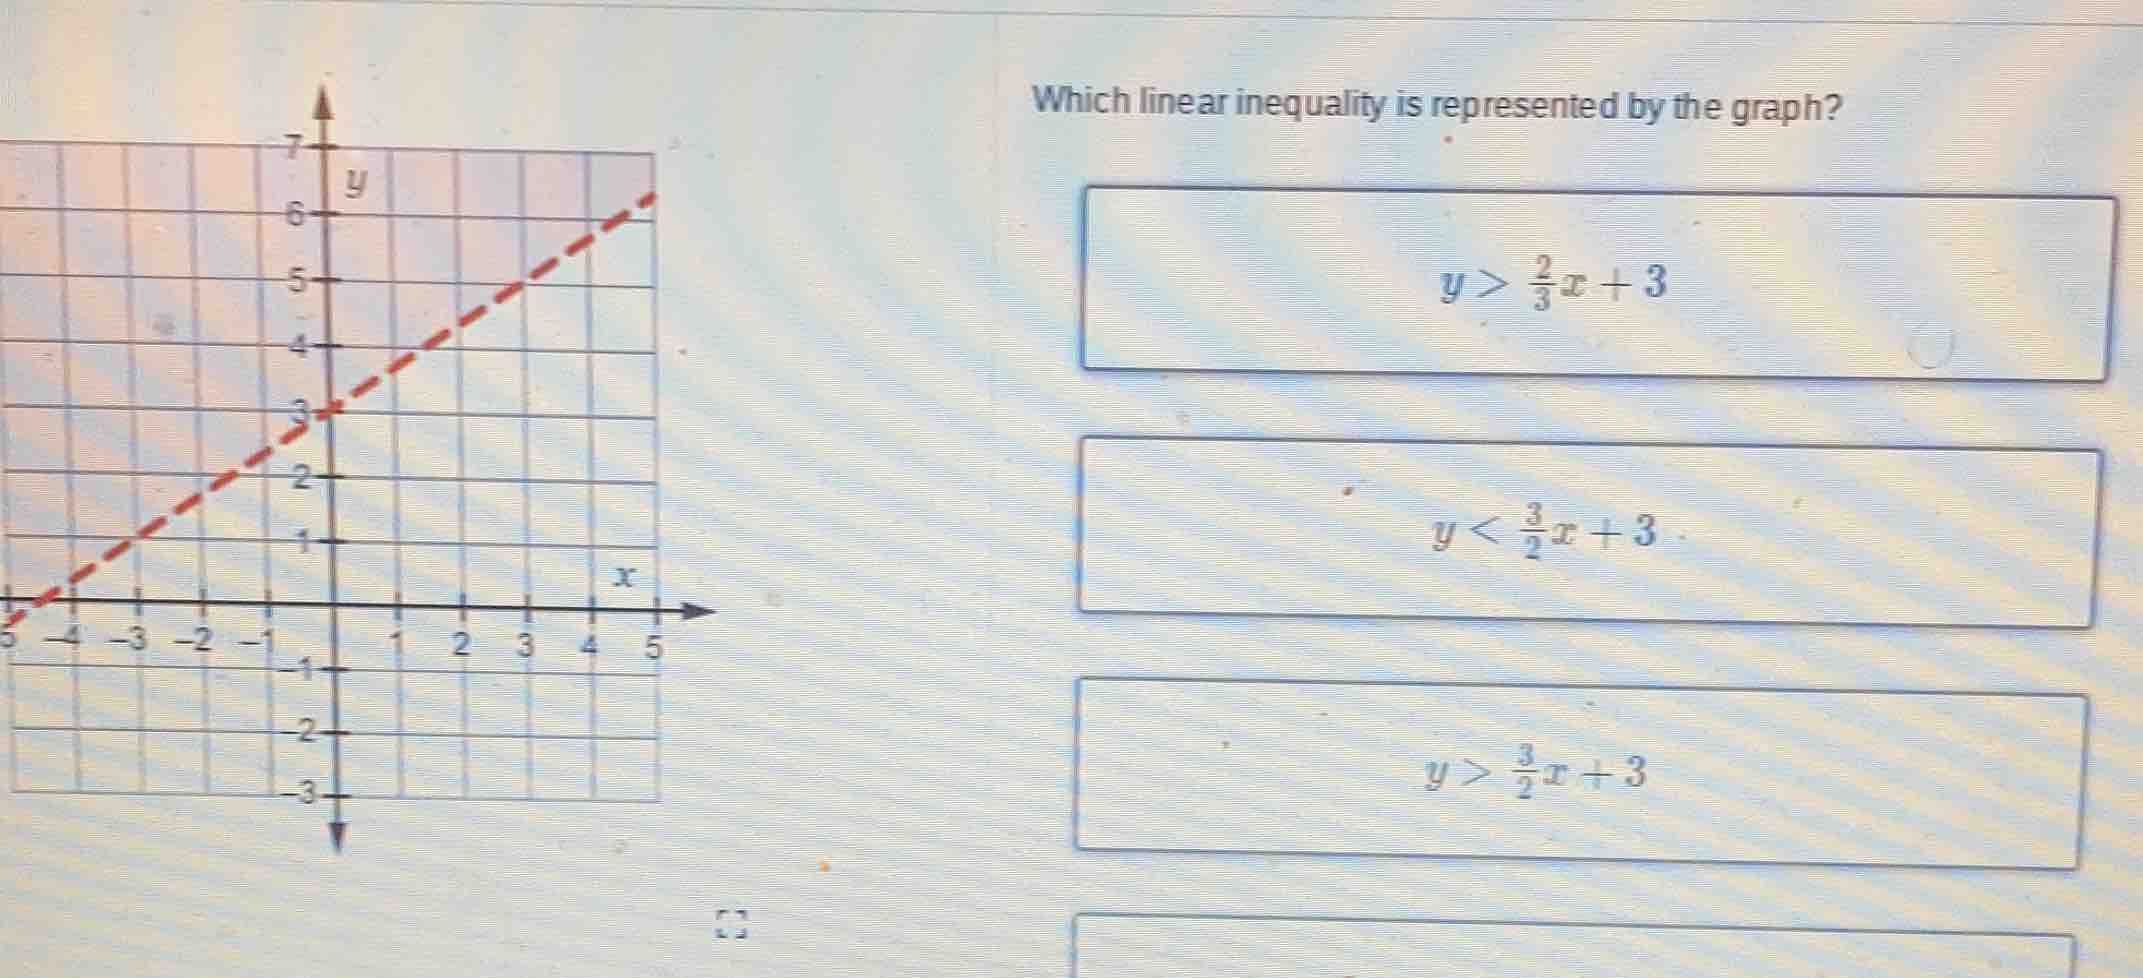
which linear inequality is represented by the graph? $y > \frac{2}{3}x + 3$ $y < \frac{3}{2}x + 3$ $y > \frac{3}{2}x + 3$
Step1: Find slope of the line
Use points $(0,3)$ and $(-5,0)$:
$$m=\frac{0-3}{-5-0}=\frac{3}{5}? \text{No, correct points: } (0,3) \text{ and } (2,6)$$
$$m=\frac{6-3}{2-0}=\frac{3}{2}$$
Step2: Identify y-intercept
The line crosses y-axis at $(0,3)$, so $b=3$. Line equation: $y=\frac{3}{2}x+3$
Step3: Determine inequality sign
Dashed line means $<$ or $>$. Test point $(0,0)$: $0 < \frac{3}{2}(0)+3$ is true, and $(0,0)$ is below the line, so $y < \frac{3}{2}x+3$

Snap & solve any problem in the app
Get step-by-step solutions on Sovi AI
Photo-based solutions with guided steps
Explore more problems and detailed explanations
$y < \frac{3}{2}x + 3$