QUESTION IMAGE
Question
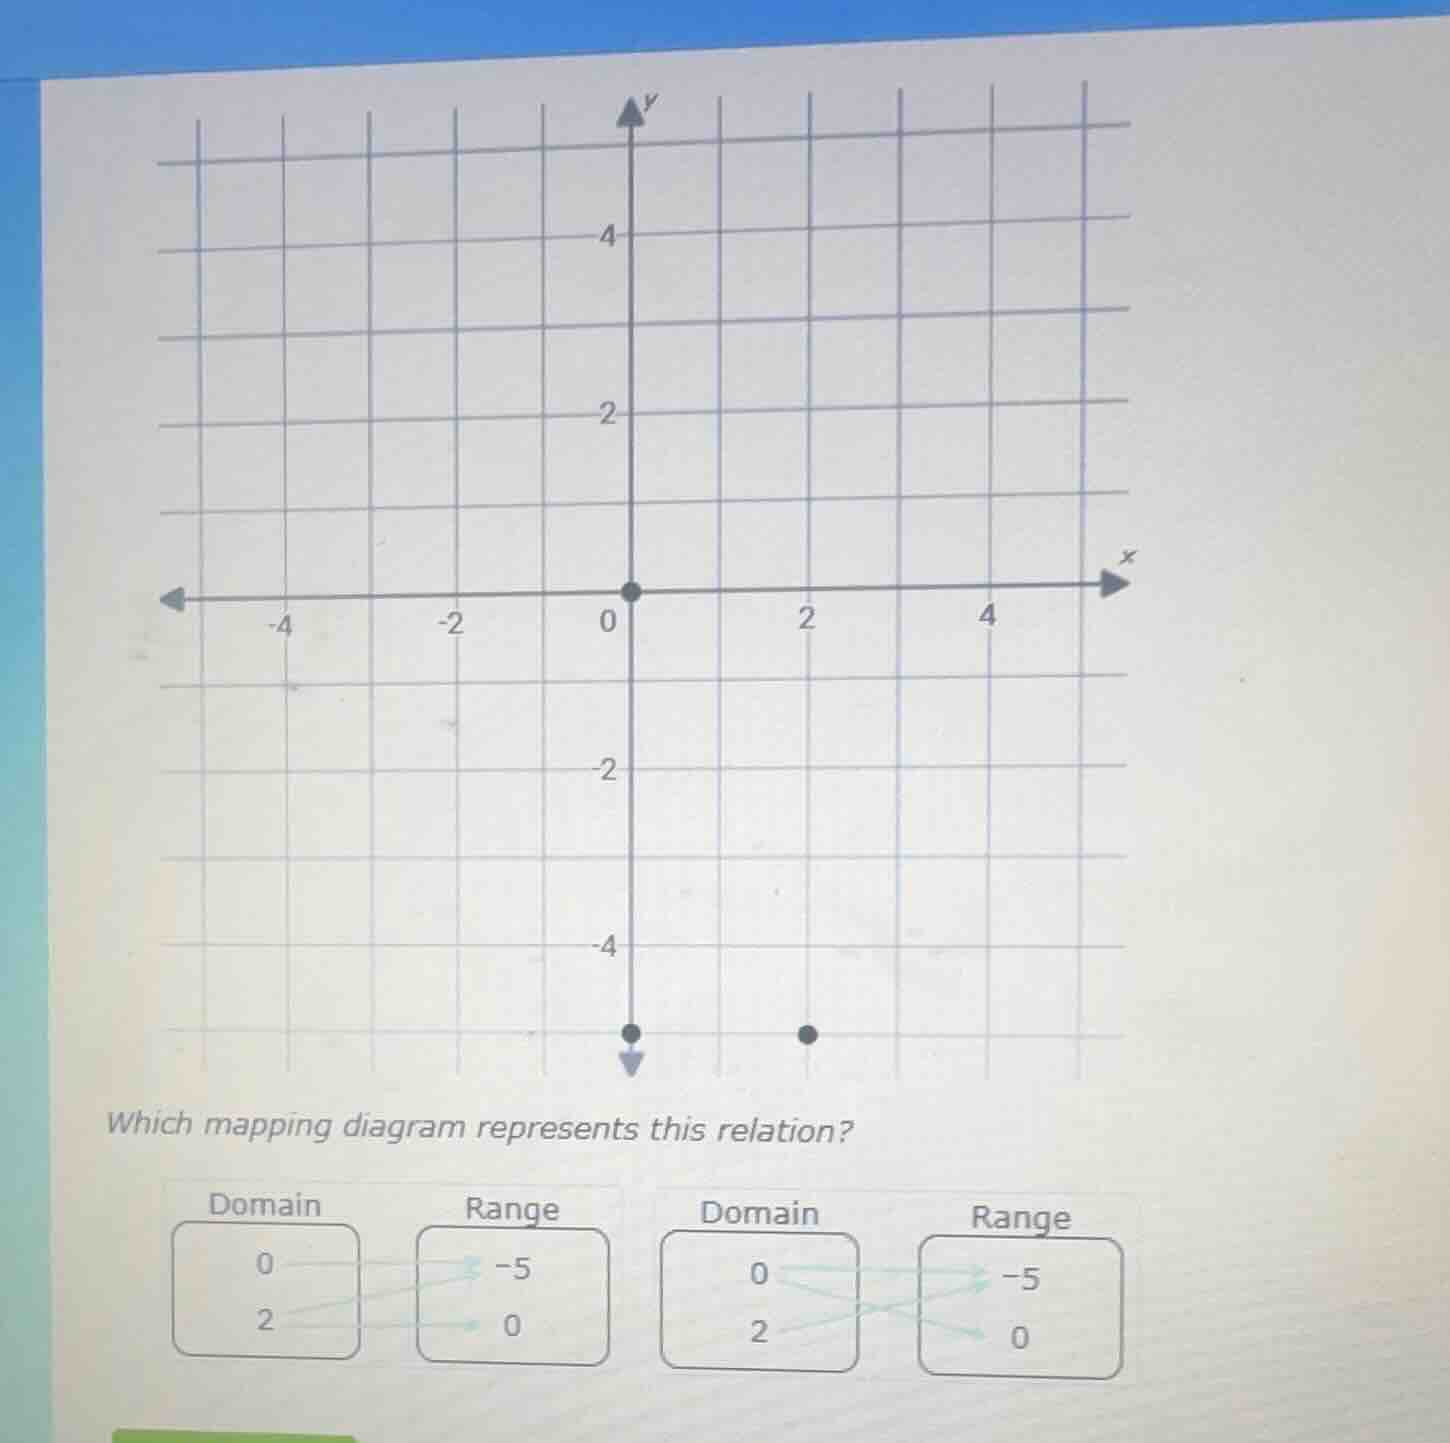
which mapping diagram represents this relation?
domain
0
2
range
-5
0
domain
0
2
range
-5
0
Step1: Identify the points from the graph
From the graph, we can see the points are \((0, 0)\), \((0, -5)\), and \((2, -5)\). So the domain values are \(0\) and \(2\), and the range values are \(0\) and \(-5\).
Step2: Analyze the mapping diagrams
- For the first mapping diagram: Check the mappings. Domain \(0\) maps to \(-5\) and \(0\)? Wait, no, wait. Wait the first diagram: Domain \(0\) has a line to \(-5\)? Wait no, let's re - examine. Wait the points are \((0,0)\), \((0, - 5)\), \((2,-5)\). So domain elements: \(0\) (maps to \(0\) and \(-5\)), \(2\) (maps to \(-5\)).
Looking at the two mapping diagrams:
First mapping diagram: Domain \(0\) and \(2\); Range \(-5\) and \(0\). The lines: \(0\) is connected to \(-5\) and \(0\)? Wait no, maybe the first diagram: \(0\) has a line to \(-5\) and \(2\) has a line to \(0\)? No, that's not right. Wait the second diagram: \(0\) is connected to \(-5\) and \(0\)? Wait no, let's list the ordered pairs: \((0,0)\), \((0, - 5)\), \((2,-5)\). So domain is \(\{0,2\}\), range is \(\{0, - 5\}\). The mapping should be: \(0\) maps to \(0\) and \(-5\); \(2\) maps to \(-5\).
Looking at the two diagrams, the second mapping diagram (the one on the right) has \(0\) connected to \(-5\) and \(0\)? Wait no, maybe I mis - saw. Wait the first diagram: Domain \(0\) and \(2\); Range \(-5\) and \(0\). The lines: \(0\) to \(-5\) and \(2\) to \(0\) – no, that's not matching. The second diagram: \(0\) to \(-5\) and \(0\) to \(0\)? Wait no, the correct mapping is: from domain \(0\), we have two range values (\(0\) and \(-5\)), and from domain \(2\), we have range value \(-5\). So the mapping diagram where \(0\) is connected to \(0\) and \(-5\), and \(2\) is connected to \(-5\) is the correct one. Looking at the two options, the second mapping diagram (the right - hand one) should represent this relation. Wait, maybe the first diagram is wrong and the second is right. Wait the ordered pairs are \((0,0)\), \((0, - 5)\), \((2,-5)\). So for domain \(0\), it maps to \(0\) and \(-5\); for domain \(2\), it maps to \(-5\). So the mapping diagram that has \(0\) connected to \(0\) and \(-5\), and \(2\) connected to \(-5\) is the correct one. Assuming the second mapping diagram (the one with \(0\) connected to \(-5\) and \(0\), and \(2\) connected to \(-5\)) is the correct one.
Wait, let's re - express the ordered pairs:
The points on the graph:
- When \(x = 0\), \(y = 0\) (the point at the origin) and \(y=-5\) (the point on the \(y\) - axis at \((0, - 5)\)).
- When \(x = 2\), \(y=-5\) (the point at \((2, - 5)\)).
So the relation is \(\{(0,0),(0, - 5),(2, - 5)\}\).
Domain: \(\{0,2\}\), Range: \(\{0, - 5\}\).
Mapping:
- \(0\) is related to \(0\) and \(-5\).
- \(2\) is related to \(-5\).
So the mapping diagram that shows \(0\) connected to \(0\) and \(-5\), and \(2\) connected to \(-5\) is the correct one. Looking at the two given mapping diagrams, the second one (the right - hand one) has \(0\) connected to \(-5\) and \(0\) (assuming the lines are drawn that way) and \(2\) connected to \(-5\).

Snap & solve any problem in the app
Get step-by-step solutions on Sovi AI
Photo-based solutions with guided steps
Explore more problems and detailed explanations
The mapping diagram on the right (the second one) where domain \(0\) is connected to range \(0\) and \(-5\), and domain \(2\) is connected to range \(-5\). (If we assume the two diagrams are labeled as left and right, the right - hand diagram is the correct one. If we use the given diagram labels, assuming the second diagram is the one with domain \(0\) and \(2\), range \(-5\) and \(0\), with \(0\) connected to \(-5\) and \(0\), and \(2\) connected to \(-5\)).