QUESTION IMAGE
Question
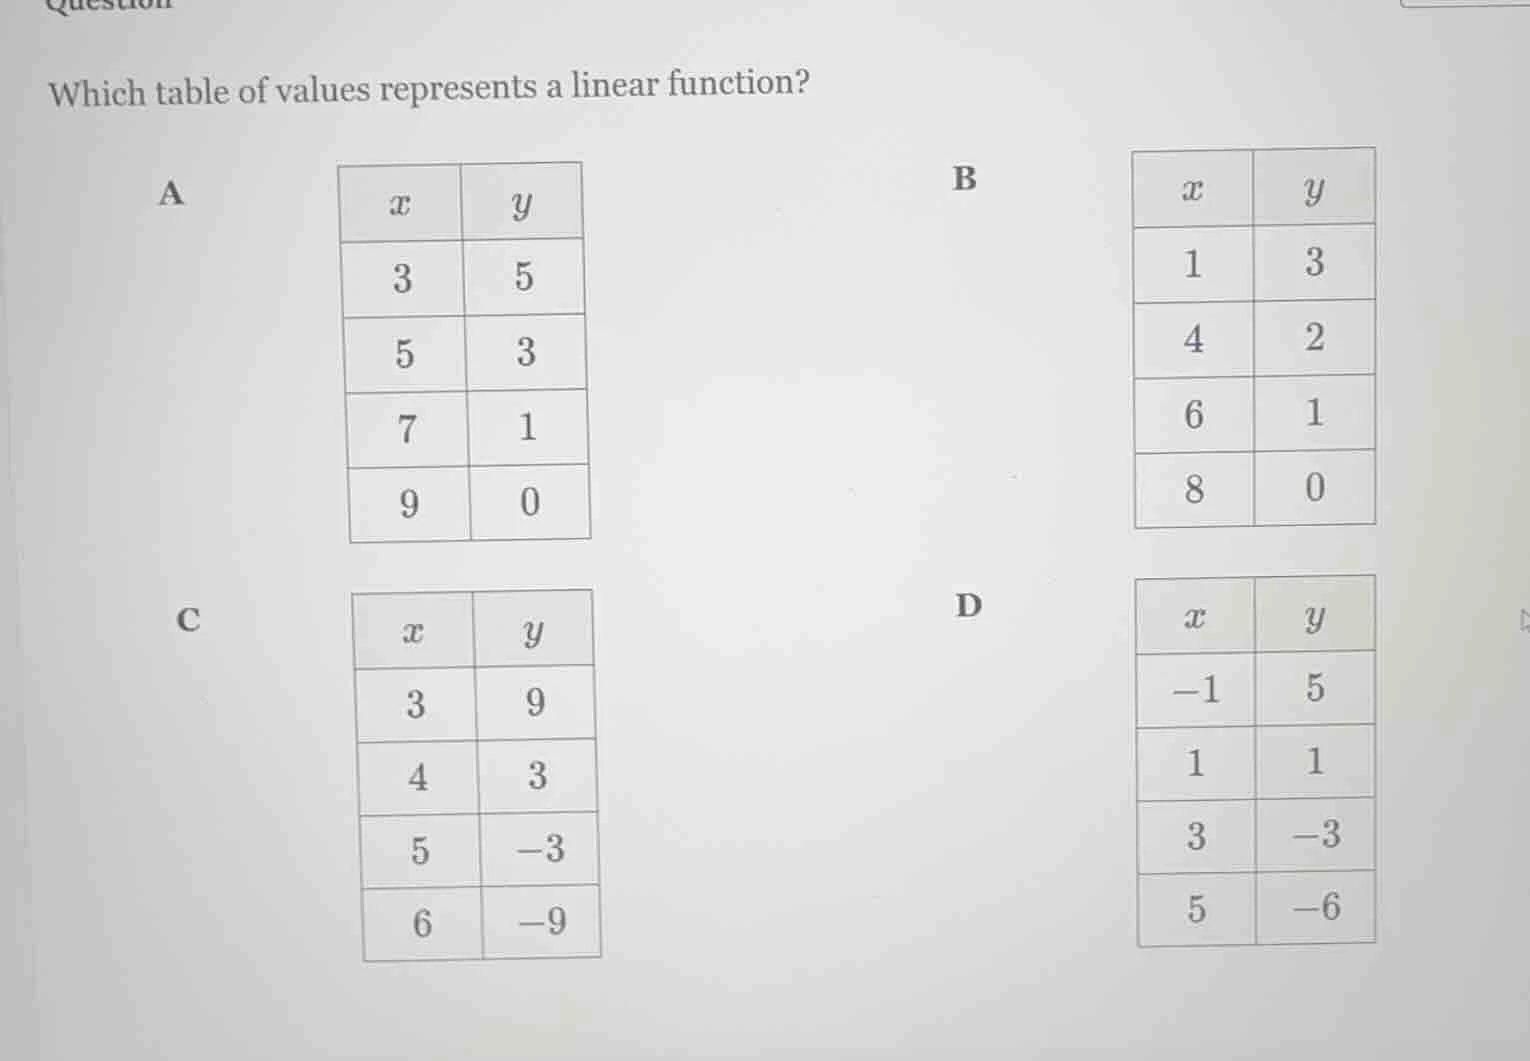
which table of values represents a linear function?
a
| x | y |
|---|---|
| 5 | 3 |
| 7 | 1 |
| 9 | 0 |
b
| x | y |
|---|---|
| 4 | 2 |
| 6 | 1 |
| 8 | 0 |
c
| x | y |
|---|---|
| 4 | 3 |
| 5 | -3 |
| 6 | -9 |
d
| x | y |
|---|---|
| 1 | 1 |
| 3 | -3 |
| 5 | -6 |
Step1: Define linear function test
A linear function has a constant rate of change, meaning $\frac{\Delta y}{\Delta x}$ is the same for all consecutive pairs of points.
Step2: Check Table A
Calculate $\Delta x$ and $\Delta y$:
- $\Delta x_1=5-3=2$, $\Delta y_1=3-5=-2$, rate: $\frac{-2}{2}=-1$
- $\Delta x_2=7-5=2$, $\Delta y_2=1-3=-2$, rate: $\frac{-2}{2}=-1$
- $\Delta x_3=9-7=2$, $\Delta y_3=0-1=-1$, rate: $\frac{-1}{2}=-0.5$
Rates are not equal.
Step3: Check Table B
Calculate $\Delta x$ and $\Delta y$:
- $\Delta x_1=4-1=3$, $\Delta y_1=2-3=-1$, rate: $\frac{-1}{3}$
- $\Delta x_2=6-4=2$, $\Delta y_2=1-2=-1$, rate: $\frac{-1}{2}$
Rates are not equal.
Step4: Check Table C
Calculate $\Delta x$ and $\Delta y$:
- $\Delta x_1=4-3=1$, $\Delta y_1=3-9=-6$, rate: $\frac{-6}{1}=-6$
- $\Delta x_2=5-4=1$, $\Delta y_2=-3-3=-6$, rate: $\frac{-6}{1}=-6$
- $\Delta x_3=6-5=1$, $\Delta y_3=-9-(-3)=-6$, rate: $\frac{-6}{1}=-6$
Rates are constant.
Step5: Verify Table D (optional)
Calculate $\Delta x$ and $\Delta y$:
- $\Delta x_1=1-(-1)=2$, $\Delta y_1=1-5=-4$, rate: $\frac{-4}{2}=-2$
- $\Delta x_2=3-1=2$, $\Delta y_2=-3-1=-4$, rate: $\frac{-4}{2}=-2$
- $\Delta x_3=5-3=2$, $\Delta y_3=-6-(-3)=-3$, rate: $\frac{-3}{2}=-1.5$
Rates are not equal.

Snap & solve any problem in the app
Get step-by-step solutions on Sovi AI
Photo-based solutions with guided steps
Explore more problems and detailed explanations
C.
| $x$ | $y$ |
|---|---|
| 4 | 3 |
| 5 | -3 |
| 6 | -9 |