QUESTION IMAGE
Question
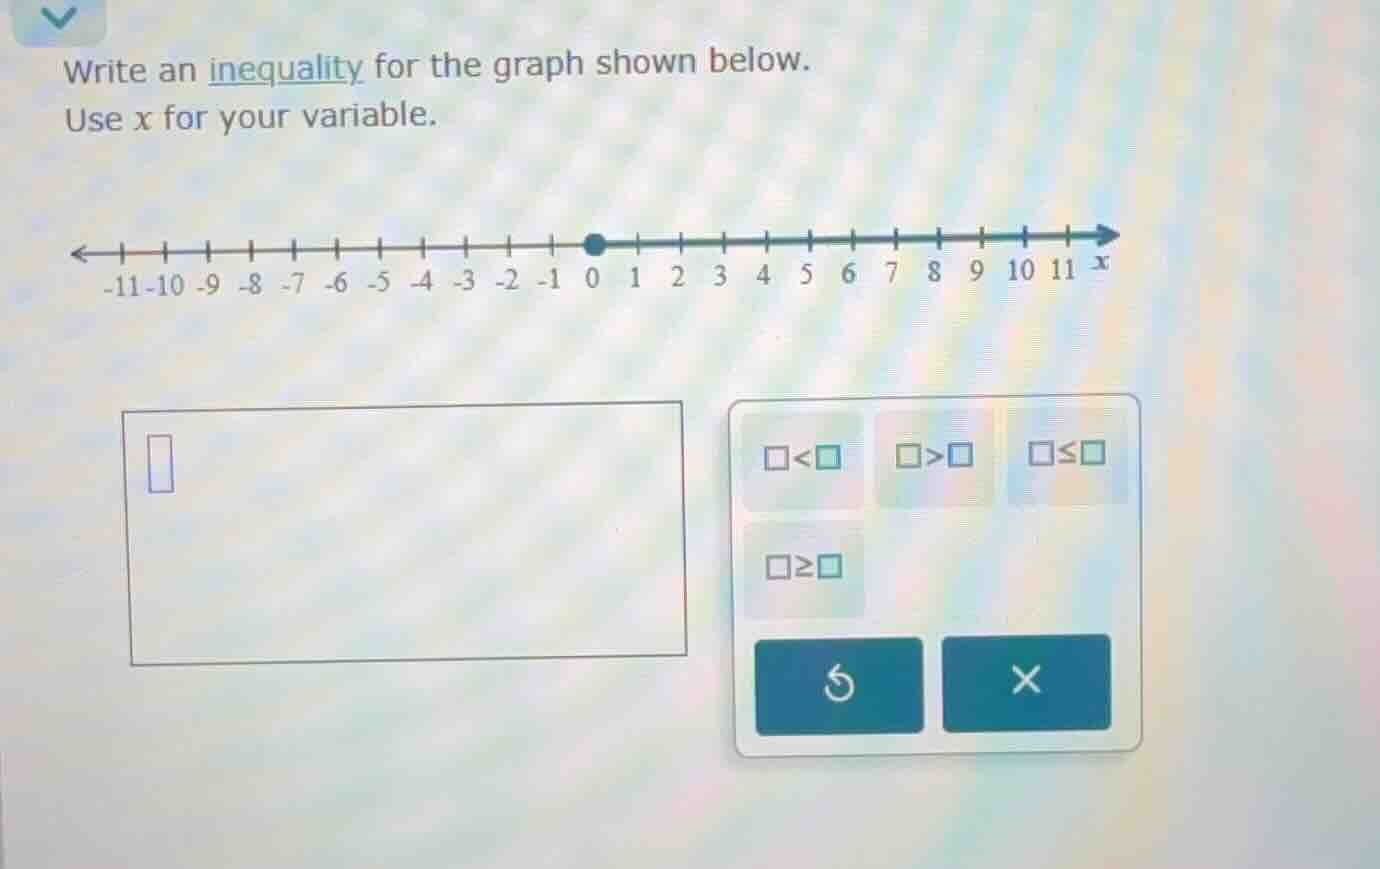
write an inequality for the graph shown below. use x for your variable.
Step1: Analyze the graph
The graph has a filled - in dot at \(x = 0\) and the line extends to the right. A filled - in dot means that the point \(x=0\) is included in the solution set. When the line extends to the right from a point \(a\) (with a filled dot), the inequality is of the form \(x\geq a\).
Step2: Determine the inequality
Since the filled dot is at \(x = 0\) and the line goes to the right, the inequality is \(x\geq0\).

Snap & solve any problem in the app
Get step-by-step solutions on Sovi AI
Photo-based solutions with guided steps
Explore more problems and detailed explanations
\(x\geq0\)