QUESTION IMAGE
Question
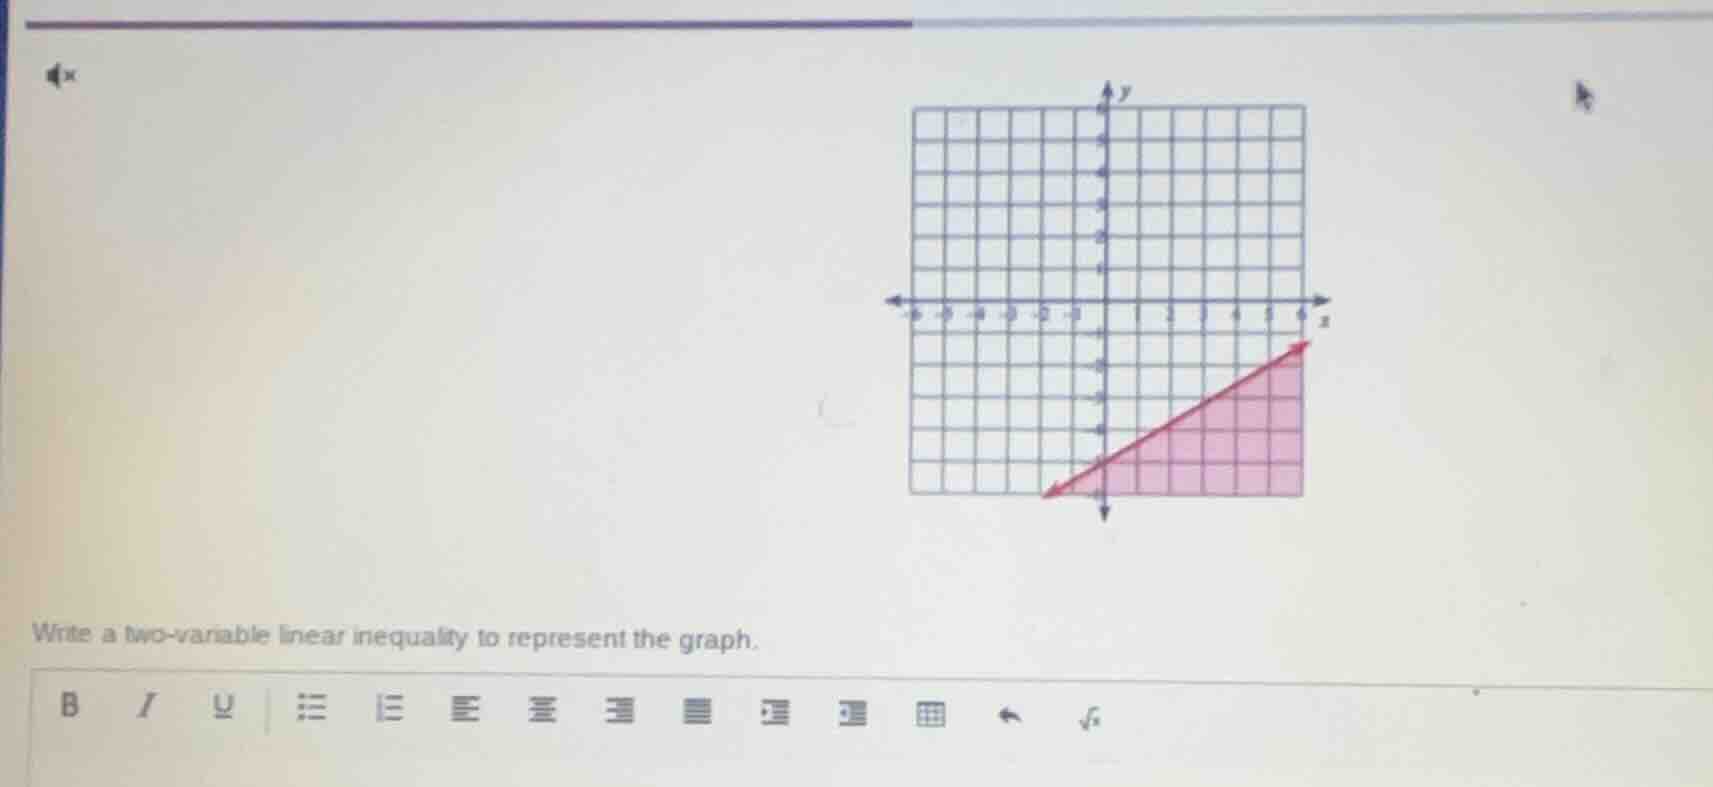
write a two - variable linear inequality to represent the graph.
Step1: Find the slope of the line
The line passes through \((0, -5)\) and \((5, 0)\). The slope \(m=\frac{y_2 - y_1}{x_2 - x_1}=\frac{0 - (-5)}{5 - 0}=\frac{5}{5} = 1\).
Step2: Find the equation of the line
Using the slope - intercept form \(y=mx + b\), where \(m = 1\) and \(b=-5\) (from the point \((0,-5)\)), the equation of the line is \(y=x - 5\).
Step3: Determine the inequality symbol
The line is solid (since the region includes the line, we use \(\geq\) or \(\leq\)) and the shaded region is above the line (we can test a point in the shaded region, e.g., \((0,0)\): \(0\) compared to \(0 - 5=-5\), \(0\geq - 5\)). So the inequality is \(y\geq x - 5\) or \(x - y\leq5\).

Snap & solve any problem in the app
Get step-by-step solutions on Sovi AI
Photo-based solutions with guided steps
Explore more problems and detailed explanations
\(y\geq x - 5\) (or \(x - y\leq5\))