QUESTION IMAGE
Question
yields by farm
duluth
grand rapids
crookston
morris
waseca
university farm
0 5 10 15 20 25 30 35 40 45 50 55 60 65 70
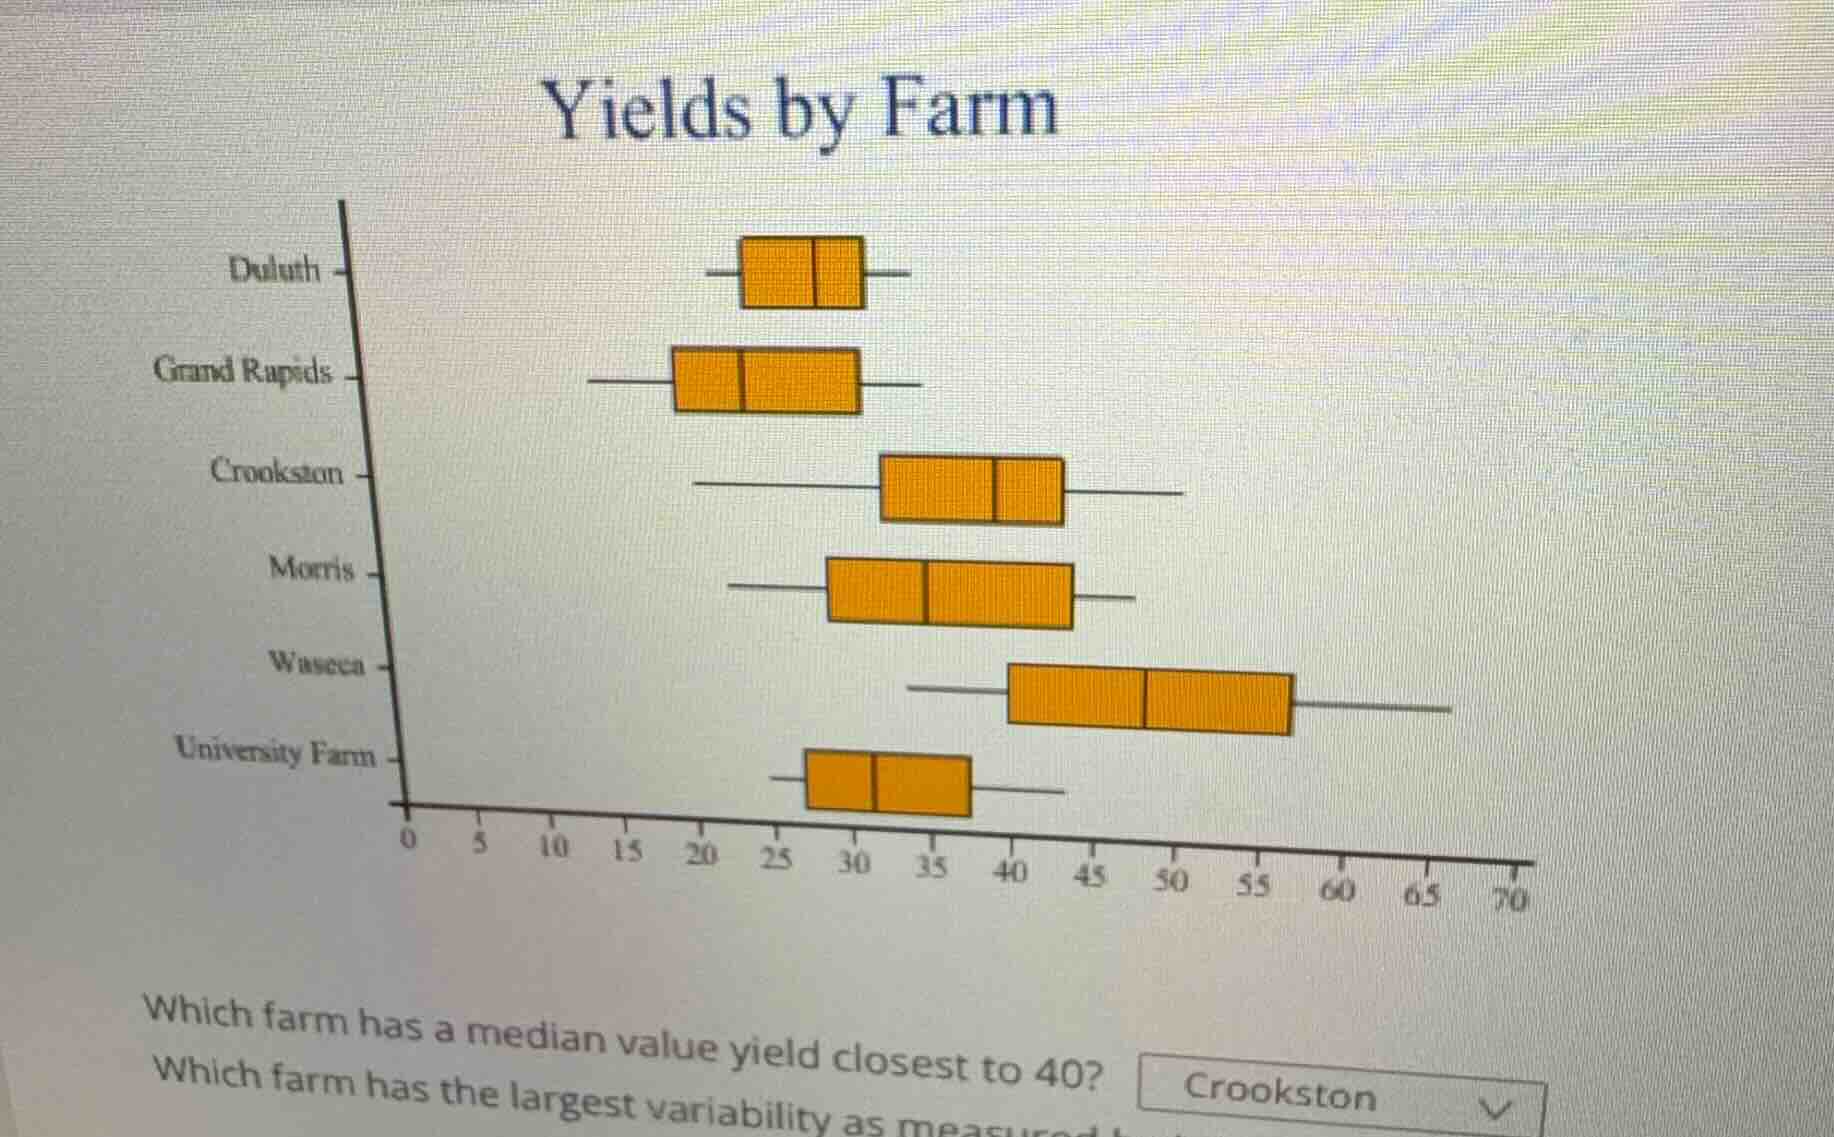
which farm has a median value yield closest to 40? crookston
which farm has the largest variability as
To determine which farm has a median yield closest to 40, we analyze the box - and - whisker plots (where the median is represented by the line inside the box):
Step 1: Recall the meaning of the median in a box - plot
In a box - and - whisker plot, the vertical line (or the line that divides the box) inside the box represents the median of the data set. We need to visually inspect the position of this median line for each farm's box - plot and see which one is closest to the value of 40 on the horizontal axis.
Step 2: Analyze each farm's box - plot
- Duluth: Looking at the box - plot for Duluth, the median line inside the box is clearly to the left of 40, probably around a value much lower than 40 (maybe in the 25 - 30 range or so).
- Grand Rapids: The median line for Grand Rapids' box - plot is also to the left of 40, likely in the 20 - 25 range.
- Crookston: The median line inside Crookston's box is relatively close to 40. By visually comparing the position of the median line with the 40 mark on the x - axis, we can see that it is closer than the medians of the other farms we have analyzed so far.
- Morris: The median line for Morris' box - plot is also in the vicinity of Crookston's median but when we make a more precise visual comparison, Crookston's median seems to be a bit closer to 40.
- Waseca: The median line for Waseca's box - plot is to the right of 40 (since the box is centered around values higher than 40, like 50 - 55 range for the median).
- University Farm: The median line for University Farm's box - plot is to the left of 40, around the 30 - 35 range.
After carefully comparing the median positions of all the farms' box - plots, we find that Crookston's median yield is closest to 40.
To determine which farm has the largest variability, we can use the inter - quartile range (IQR, the length of the box) or the range (the distance between the minimum and maximum values, represented by the whiskers). The larger the spread of the box (IQR) and the whiskers, the larger the variability.
Step 1: Recall how to measure variability from a box - plot
Variability can be measured by the range (max - min) or the inter - quartile range (IQR = Q3 - Q1, where Q3 is the third quartile and Q1 is the first quartile, and the box represents the middle 50% of the data between Q1 and Q3). A larger range or a larger IQR indicates more variability.
Step 2: Analyze the variability of each farm
- Duluth: The box is relatively narrow and the whiskers are short, so the range and IQR are small.
- Grand Rapids: The box and whiskers are not as spread out as some other farms.
- Crookston: The box is of moderate width, but the whiskers extend a fair amount. However, when we look at Waseca:
- Waseca: The box is wide and the whiskers extend a long way (from a relatively low minimum to a high maximum). The length of the box (IQR) and the range (distance between the end of the lower whisker and the end of the upper whisker) are larger than that of the other farms.
- Morris: The box and whiskers are not as spread out as Waseca's.
- University Farm: The box and whiskers are relatively compact.
So, the farm with the largest variability is Waseca.
Final Answers
- The farm with a median yield closest to 40 is Crookston.
- The farm with the largest variability is Waseca.

Snap & solve any problem in the app
Get step-by-step solutions on Sovi AI
Photo-based solutions with guided steps
Explore more problems and detailed explanations
To determine which farm has a median yield closest to 40, we analyze the box - and - whisker plots (where the median is represented by the line inside the box):
Step 1: Recall the meaning of the median in a box - plot
In a box - and - whisker plot, the vertical line (or the line that divides the box) inside the box represents the median of the data set. We need to visually inspect the position of this median line for each farm's box - plot and see which one is closest to the value of 40 on the horizontal axis.
Step 2: Analyze each farm's box - plot
- Duluth: Looking at the box - plot for Duluth, the median line inside the box is clearly to the left of 40, probably around a value much lower than 40 (maybe in the 25 - 30 range or so).
- Grand Rapids: The median line for Grand Rapids' box - plot is also to the left of 40, likely in the 20 - 25 range.
- Crookston: The median line inside Crookston's box is relatively close to 40. By visually comparing the position of the median line with the 40 mark on the x - axis, we can see that it is closer than the medians of the other farms we have analyzed so far.
- Morris: The median line for Morris' box - plot is also in the vicinity of Crookston's median but when we make a more precise visual comparison, Crookston's median seems to be a bit closer to 40.
- Waseca: The median line for Waseca's box - plot is to the right of 40 (since the box is centered around values higher than 40, like 50 - 55 range for the median).
- University Farm: The median line for University Farm's box - plot is to the left of 40, around the 30 - 35 range.
After carefully comparing the median positions of all the farms' box - plots, we find that Crookston's median yield is closest to 40.
To determine which farm has the largest variability, we can use the inter - quartile range (IQR, the length of the box) or the range (the distance between the minimum and maximum values, represented by the whiskers). The larger the spread of the box (IQR) and the whiskers, the larger the variability.
Step 1: Recall how to measure variability from a box - plot
Variability can be measured by the range (max - min) or the inter - quartile range (IQR = Q3 - Q1, where Q3 is the third quartile and Q1 is the first quartile, and the box represents the middle 50% of the data between Q1 and Q3). A larger range or a larger IQR indicates more variability.
Step 2: Analyze the variability of each farm
- Duluth: The box is relatively narrow and the whiskers are short, so the range and IQR are small.
- Grand Rapids: The box and whiskers are not as spread out as some other farms.
- Crookston: The box is of moderate width, but the whiskers extend a fair amount. However, when we look at Waseca:
- Waseca: The box is wide and the whiskers extend a long way (from a relatively low minimum to a high maximum). The length of the box (IQR) and the range (distance between the end of the lower whisker and the end of the upper whisker) are larger than that of the other farms.
- Morris: The box and whiskers are not as spread out as Waseca's.
- University Farm: The box and whiskers are relatively compact.
So, the farm with the largest variability is Waseca.
Final Answers
- The farm with a median yield closest to 40 is Crookston.
- The farm with the largest variability is Waseca.