QUESTION IMAGE
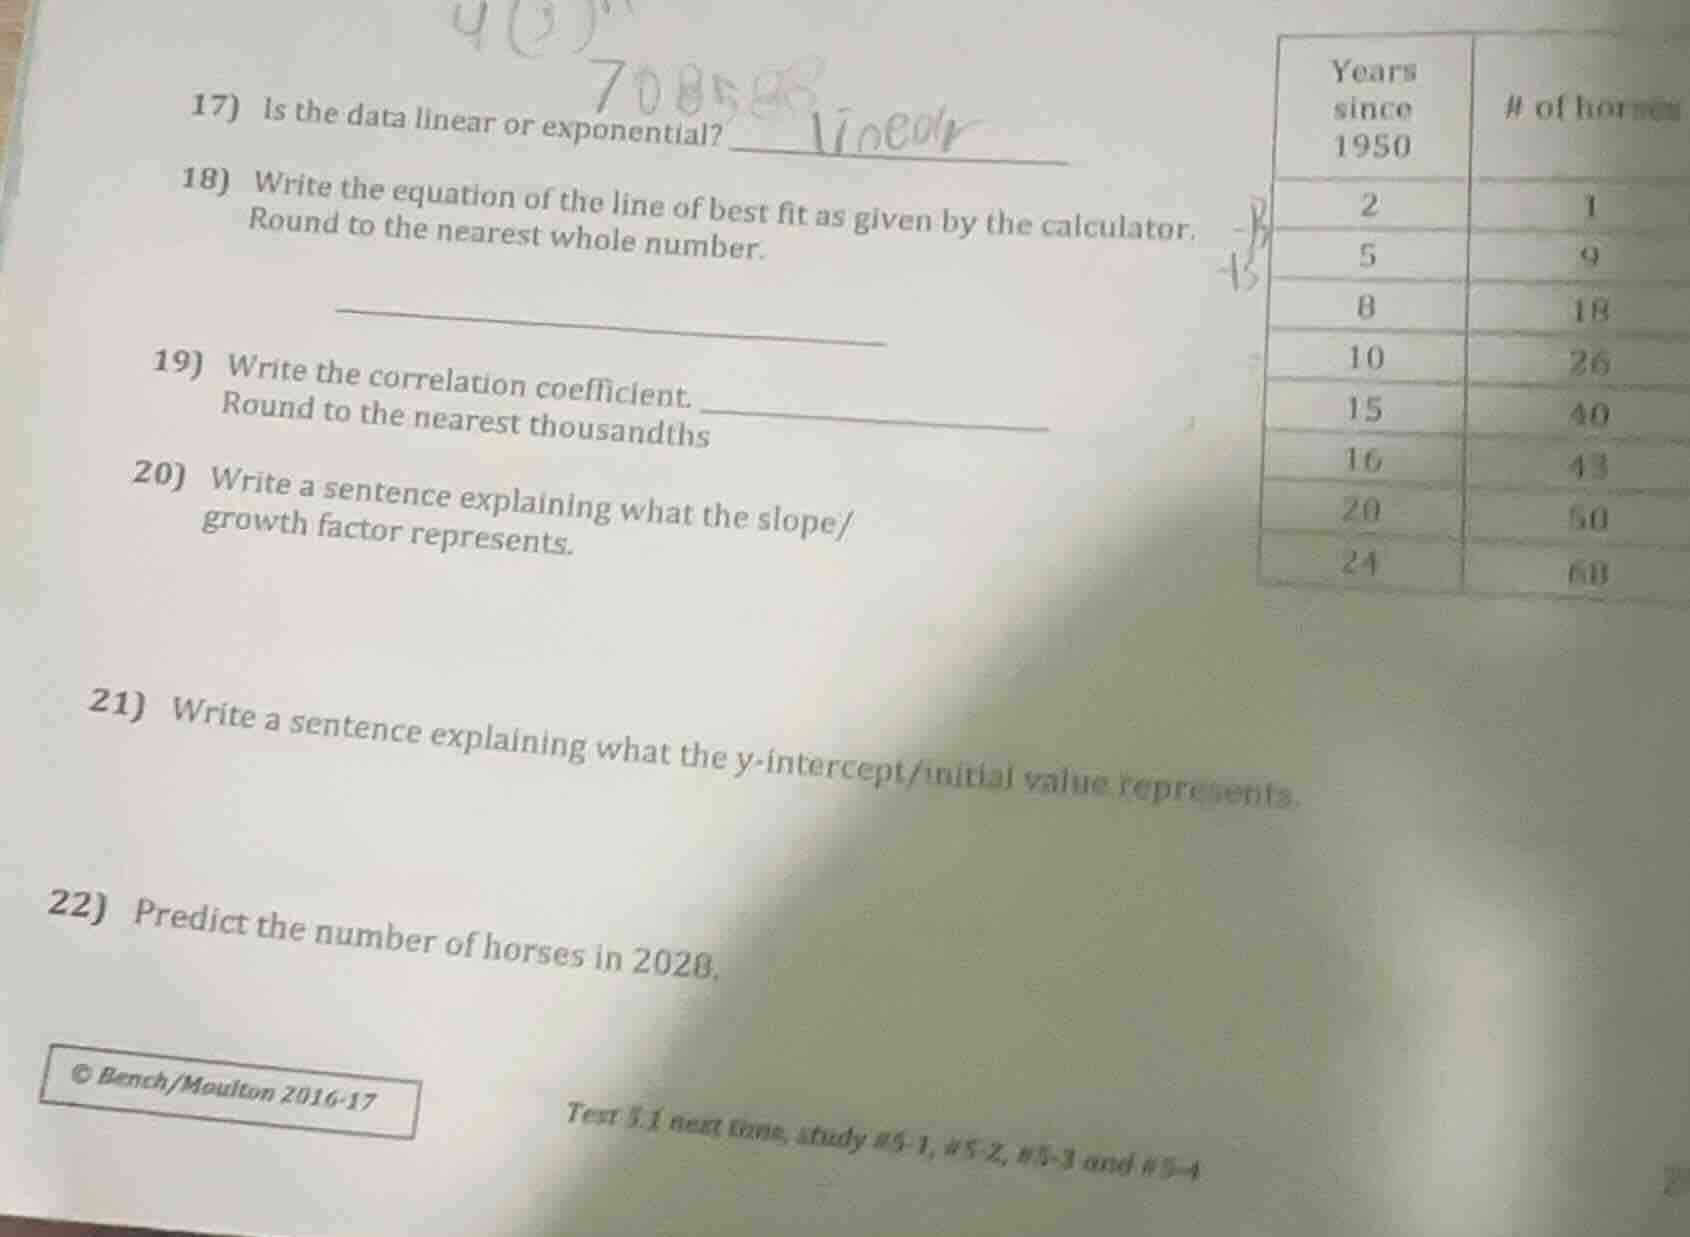
Question
- is the data linear or exponential?
- write the equation of the line of best fit as given by the calculator. round to the nearest whole number.
- write the correlation coefficient. round to the nearest thousandths
- write a sentence explaining what the slope/
growth factor represents.
- write a sentence explaining what the y - intercept/initial value represents.
- predict the number of horses in 2020.
© bench/moulton 2016 - 17
test 5.1 next time, study #5 - 1, #5 - 2, #5 - 3 and #5 - 4
Step1: Confirm linearity (Q17)
Check rate of change consistency:
$\Delta y_1 = 9-1=8, \Delta x_1=5-2=3$, rate $\frac{8}{3}\approx2.67$
$\Delta y_2 = 18-9=9, \Delta x_2=8-5=3$, rate $\frac{9}{3}=3$
$\Delta y_3 = 26-18=8, \Delta x_3=10-8=2$, rate $\frac{8}{2}=4$
$\Delta y_4 = 40-26=14, \Delta x_4=15-10=5$, rate $\frac{14}{5}=2.8$
$\Delta y_5 = 43-40=3, \Delta x_5=16-15=1$, rate $\frac{3}{1}=3$
$\Delta y_6 = 50-43=7, \Delta x_6=20-16=4$, rate $\frac{7}{4}=1.75$
$\Delta y_7 = 60-50=10, \Delta x_7=24-20=4$, rate $\frac{10}{4}=2.5$
Rates are close, so data is linear.
Step2: Calculate line of best fit (Q18)
Use linear regression formula. Let $x$ = years since 1950, $y$ = # of horses.
First, calculate sums:
$n=8$
$\sum x=2+5+8+10+15+16+20+24=100$
$\sum y=1+9+18+26+40+43+50+60=247$
$\sum xy=(2*1)+(5*9)+(8*18)+(10*26)+(15*40)+(16*43)+(20*50)+(24*60)=2+45+144+260+600+688+1000+1440=4179$
$\sum x^2=2^2+5^2+8^2+10^2+15^2+16^2+20^2+24^2=4+25+64+100+225+256+400+576=1650$
Slope $m=\frac{n\sum xy - \sum x \sum y}{n\sum x^2 - (\sum x)^2}$
$m=\frac{8*4179 - 100*247}{8*1650 - 100^2}=\frac{33432-24700}{13200-10000}=\frac{8732}{3200}\approx2.73$
Round to whole number: $m=3$
Y-intercept $b=\frac{\sum y - m\sum x}{n}$
$b=\frac{247 - 3*100}{8}=\frac{247-300}{8}=\frac{-53}{8}\approx-6.63$
Round to whole number: $b=-7$
Equation: $y=3x-7$
Step3: Calculate correlation coefficient (Q19)
Use formula $r=\frac{n\sum xy - \sum x \sum y}{\sqrt{[n\sum x^2 - (\sum x)^2][n\sum y^2 - (\sum y)^2]}}$
First, $\sum y^2=1^2+9^2+18^2+26^2+40^2+43^2+50^2+60^2=1+81+324+676+1600+1849+2500+3600=10631$
Numerator: $8*4179 - 100*247=8732$
Denominator part1: $8*1650 - 100^2=3200$
Denominator part2: $8*10631 - 247^2=85048-61009=24039$
Denominator: $\sqrt{3200*24039}=\sqrt{76924800}\approx8770.68$
$r=\frac{8732}{8770.68}\approx0.9956$
Round to nearest thousandths: $r=0.996$
Step4: Interpret slope (Q20)
Slope is 3, so it represents the approximate annual increase in the number of horses.
Step5: Interpret y-intercept (Q21)
Y-intercept is -7, which represents the estimated number of horses in 1950 (when $x=0$); the negative value is a model approximation since horse count can't be negative.
Step6: Predict 2028 horse count (Q22)
Calculate $x$ for 2028: $2028-1950=78$
Substitute into $y=3x-7$:
$y=3*78 -7=234-7=227$

Snap & solve any problem in the app
Get step-by-step solutions on Sovi AI
Photo-based solutions with guided steps
Explore more problems and detailed explanations
- Linear
- $y=3x-7$
- $0.996$
- The slope means the number of horses increases by approximately 3 each year.
- The y-intercept is the estimated (negative, approximate) number of horses in 1950, a model prediction.
- 227