QUESTION IMAGE
Question
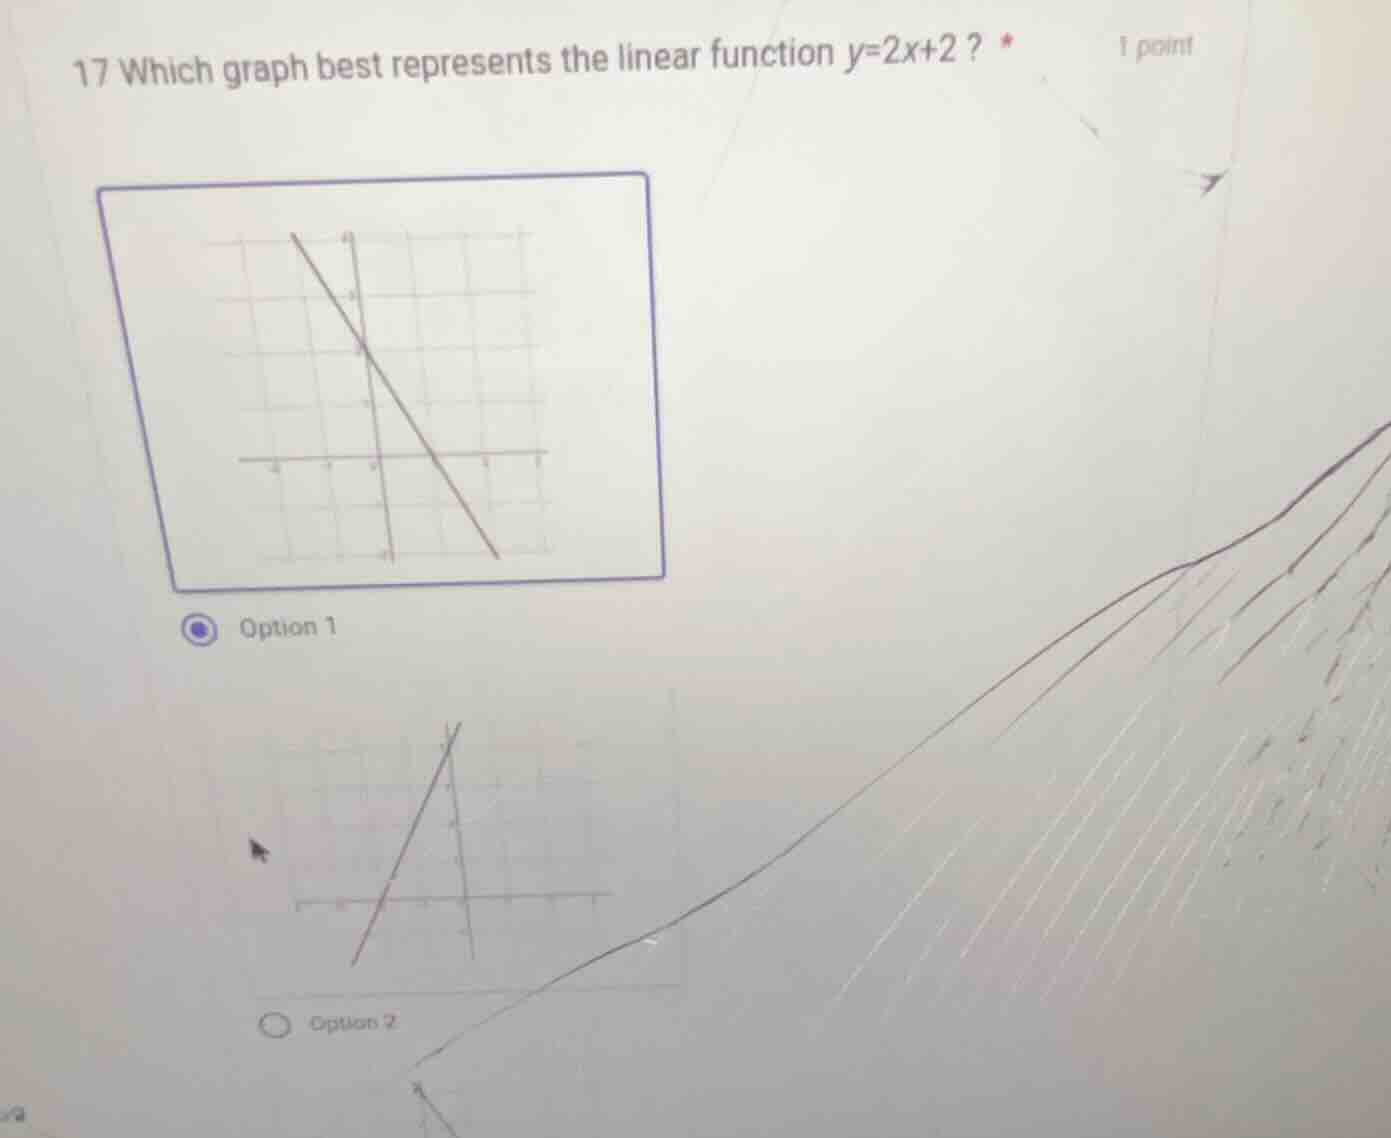
17 which graph best represents the linear function $y = 2x + 2$? * 1 point option 1 option 2
Step1: Analyze the slope and y-intercept
The linear function is given by \( y = 2x + 2 \). In the slope - intercept form \( y=mx + b \), \( m \) is the slope and \( b \) is the y - intercept. Here, \( m = 2 \) (positive slope, so the line should be increasing from left to right) and \( b=2 \) (the line intersects the y - axis at \( (0,2) \)).
Step2: Analyze Option 1
The line in Option 1 has a negative slope (it is decreasing from left to right), which does not match the slope \( m = 2 \) (positive) of the function \( y = 2x+2 \).
Step3: Analyze Option 2
The line in Option 2 has a positive slope (increasing from left to right) and we can check the y - intercept. When \( x = 0 \), for the function \( y=2x + 2 \), \( y=2 \). Also, the slope of 2 means that for every 1 unit increase in \( x \), \( y \) increases by 2 units. The line in Option 2 is consistent with the slope and y - intercept of the function \( y = 2x+2 \).

Snap & solve any problem in the app
Get step-by-step solutions on Sovi AI
Photo-based solutions with guided steps
Explore more problems and detailed explanations
Option 2 (the graph in Option 2) best represents the linear function \( y = 2x + 2 \).