QUESTION IMAGE
Question
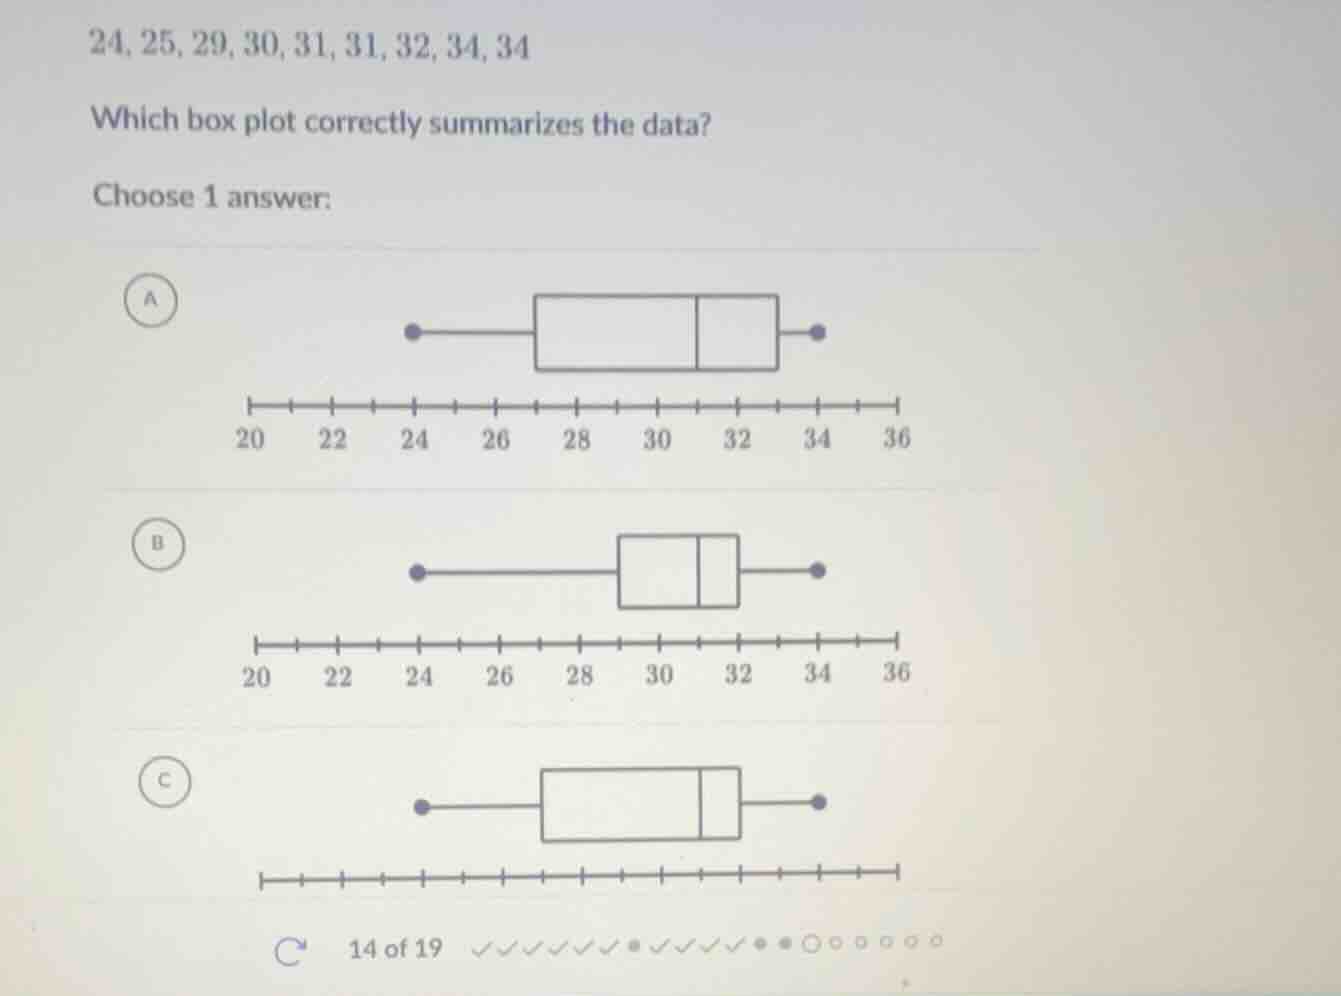
24, 25, 29, 30, 31, 31, 32, 34, 34
which box plot correctly summarizes the data?
choose 1 answer:
a
box plot a
20 22 24 26 28 30 32 34 36
b
box plot b
20 22 24 26 28 30 32 34 36
c
box plot c
number line
14 of 19
Step1: Identify min and max
Minimum value: $24$, Maximum value: $34$
Step2: Calculate median (5th value)
Data sorted: $24,25,29,30,31,31,32,34,34$
Median: $31$
Step3: Find Q1 (2nd value)
Lower half: $24,25,29,30$
Q1 (median of lower half): $25$
Step4: Find Q3 (7th value)
Upper half: $31,32,34,34$
Q3 (median of upper half): $32$
Step5: Match to box plot
Box plot should have whiskers at 24 and 34, box edges at 25 and 32, median line at 31.

Snap & solve any problem in the app
Get step-by-step solutions on Sovi AI
Photo-based solutions with guided steps
Explore more problems and detailed explanations
A. <Box plot with left whisker at 24, left box edge at 25, median line at 31, right box edge at 32, right whisker at 34>