QUESTION IMAGE
Question
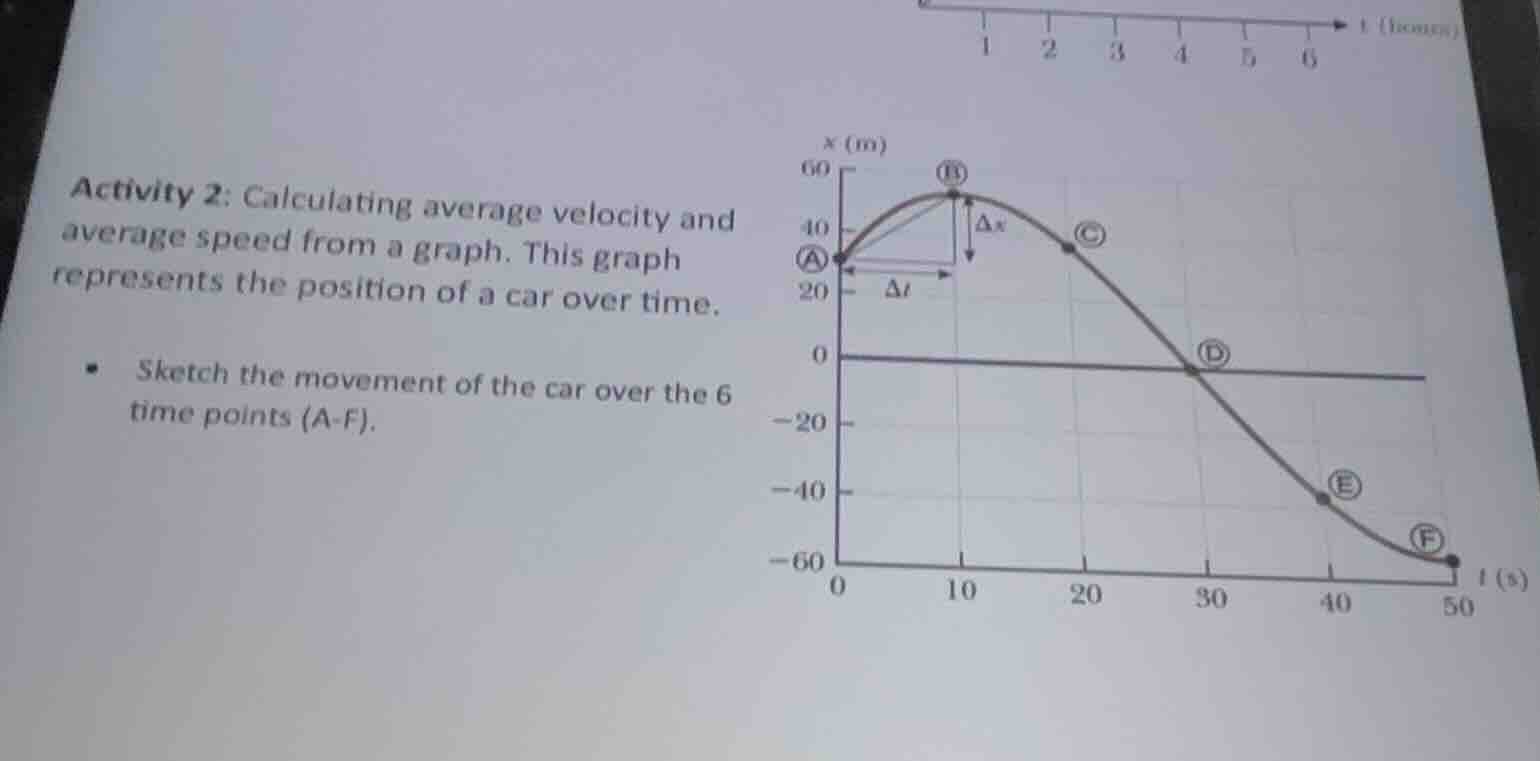
activity 2: calculating average velocity and average speed from a graph. this graph represents the position of a car over time. - sketch the movement of the car over the 6 time points (a - f).
Brief Explanations
- Point A (t=0s, x=30m): Start at position 30 meters from the origin.
- Point B (t=10s, x=50m): Move 20 meters forward to reach 50 meters at 10 seconds (this is the farthest point from the origin).
- Point C (t=20s, x=30m): Move 20 meters backward to return to the 30-meter position at 20 seconds.
- Point D (t=30s, x=0m): Move 30 meters backward to reach the origin (0 meters) at 30 seconds.
- Point E (t=40s, x=-40m): Move 40 meters backward past the origin to -40 meters at 40 seconds.
- Point F (t=50s, x=-60m): Move 20 meters farther backward to reach -60 meters at 50 seconds.
The path is a smooth curve matching the position-time graph's shape: increasing to a peak at B, then decreasing continuously through C, D, E, to F.

Snap & solve any problem in the app
Get step-by-step solutions on Sovi AI
Photo-based solutions with guided steps
Explore more problems and detailed explanations
The car's movement is as follows:
- Starts at 30 m (Point A, t=0s)
- Moves forward to 50 m (Point B, t=10s, peak position)
- Moves backward to 30 m (Point C, t=20s)
- Continues backward to 0 m (Point D, t=30s, origin)
- Moves past the origin to -40 m (Point E, t=40s)
- Ends at -60 m (Point F, t=50s)
The sketch would be a smooth curve that rises from A to B, then falls steadily through C, D, E, to F, mirroring the position-time graph's trajectory.