QUESTION IMAGE
Question
algebra i b-cr
pre-test complete
1 2 3 4 5 6
time
5
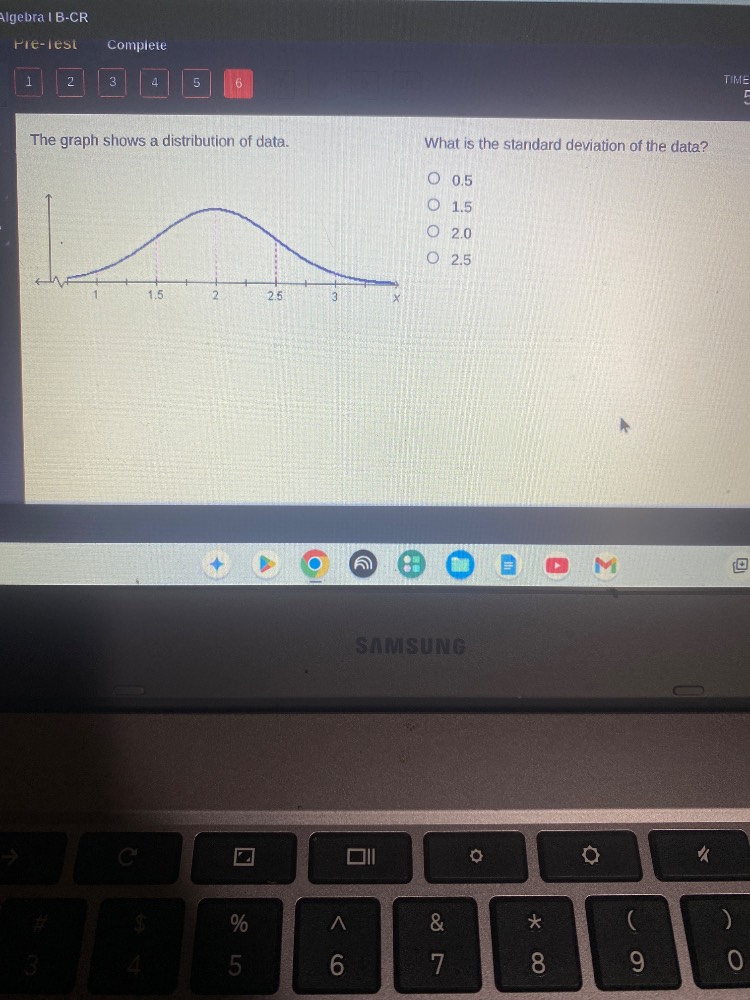
the graph shows a distribution of data.
what is the standard deviation of the data?
0.5
1.5
2.0
2.5
Step1: Identify mean of distribution
The peak of the normal curve is at $\mu = 2$, which is the mean.
Step2: Find 1σ from mean
In a normal distribution, the points where the curve changes concavity (inflection points) are at $\mu \pm \sigma$. The inflection points are at $1.5$ and $2.5$.
Step3: Calculate standard deviation
Subtract mean from upper inflection point:
$\sigma = 2.5 - 2$

Snap & solve any problem in the app
Get step-by-step solutions on Sovi AI
Photo-based solutions with guided steps
Explore more problems and detailed explanations
0.5