QUESTION IMAGE
Question
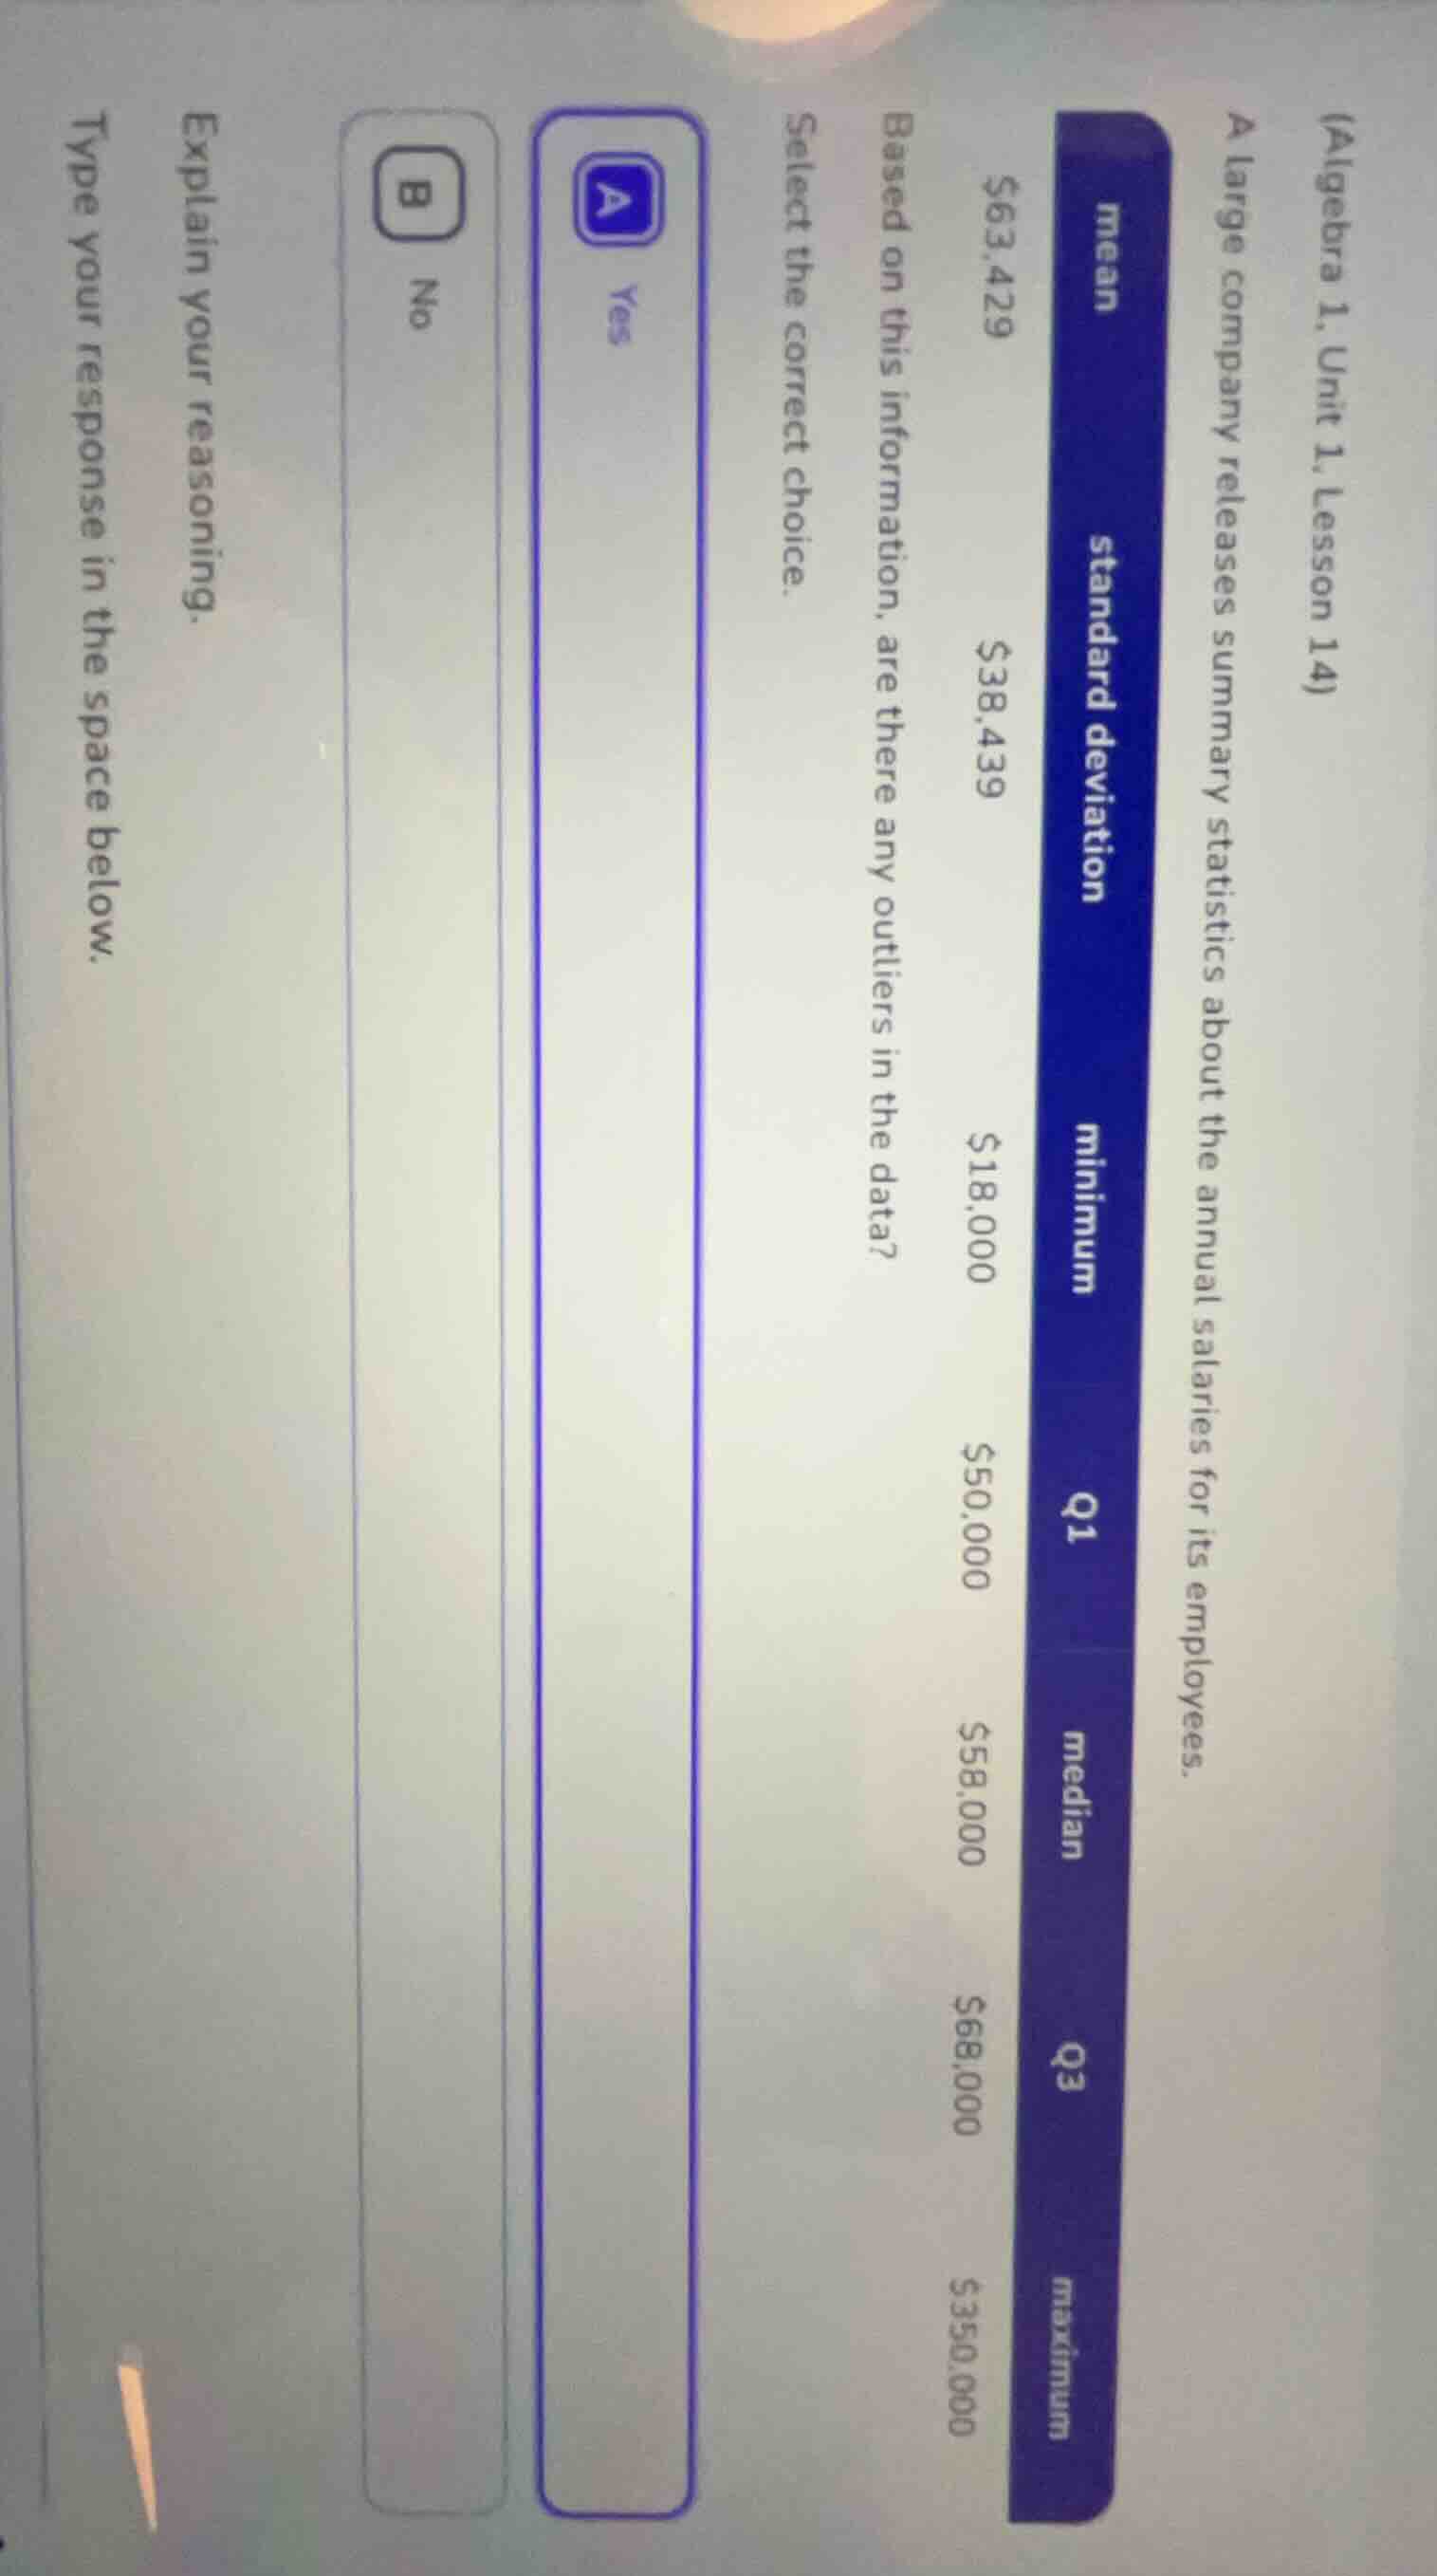
(algebra 1, unit 1, lesson 14)
a large company releases summary statistics about the annual salaries for its employees.
mean: $63,429
standard deviation: $38,439
minimum: $18,000
q1: $50,000
median: $58,000
q3: $68,000
maximum: $350,000
based on this information, are there any outliers in the data?
select the correct choice.
a yes
b no
explain your reasoning.
type your response in the space below.
Step1: Calculate IQR
$IQR = Q3 - Q1 = 68000 - 50000 = 18000$
Step2: Find lower outlier threshold
$\text{Lower Threshold} = Q1 - 1.5\times IQR = 50000 - 1.5\times18000 = 23000$
Step3: Find upper outlier threshold
$\text{Upper Threshold} = Q3 + 1.5\times IQR = 68000 + 1.5\times18000 = 95000$
Step4: Compare data to thresholds
Minimum ($18000$) < $23000$; Maximum ($350000$) > $95000$

Snap & solve any problem in the app
Get step-by-step solutions on Sovi AI
Photo-based solutions with guided steps
Explore more problems and detailed explanations
A. Yes
Reasoning:
Using the IQR method, the interquartile range (IQR) is $18,000$. The lower outlier threshold is $23,000$, and the minimum salary of $18,000$ falls below this. The upper outlier threshold is $95,000$, and the maximum salary of $350,000$ falls far above this. Both values are outliers.