QUESTION IMAGE
Question
analyzing data
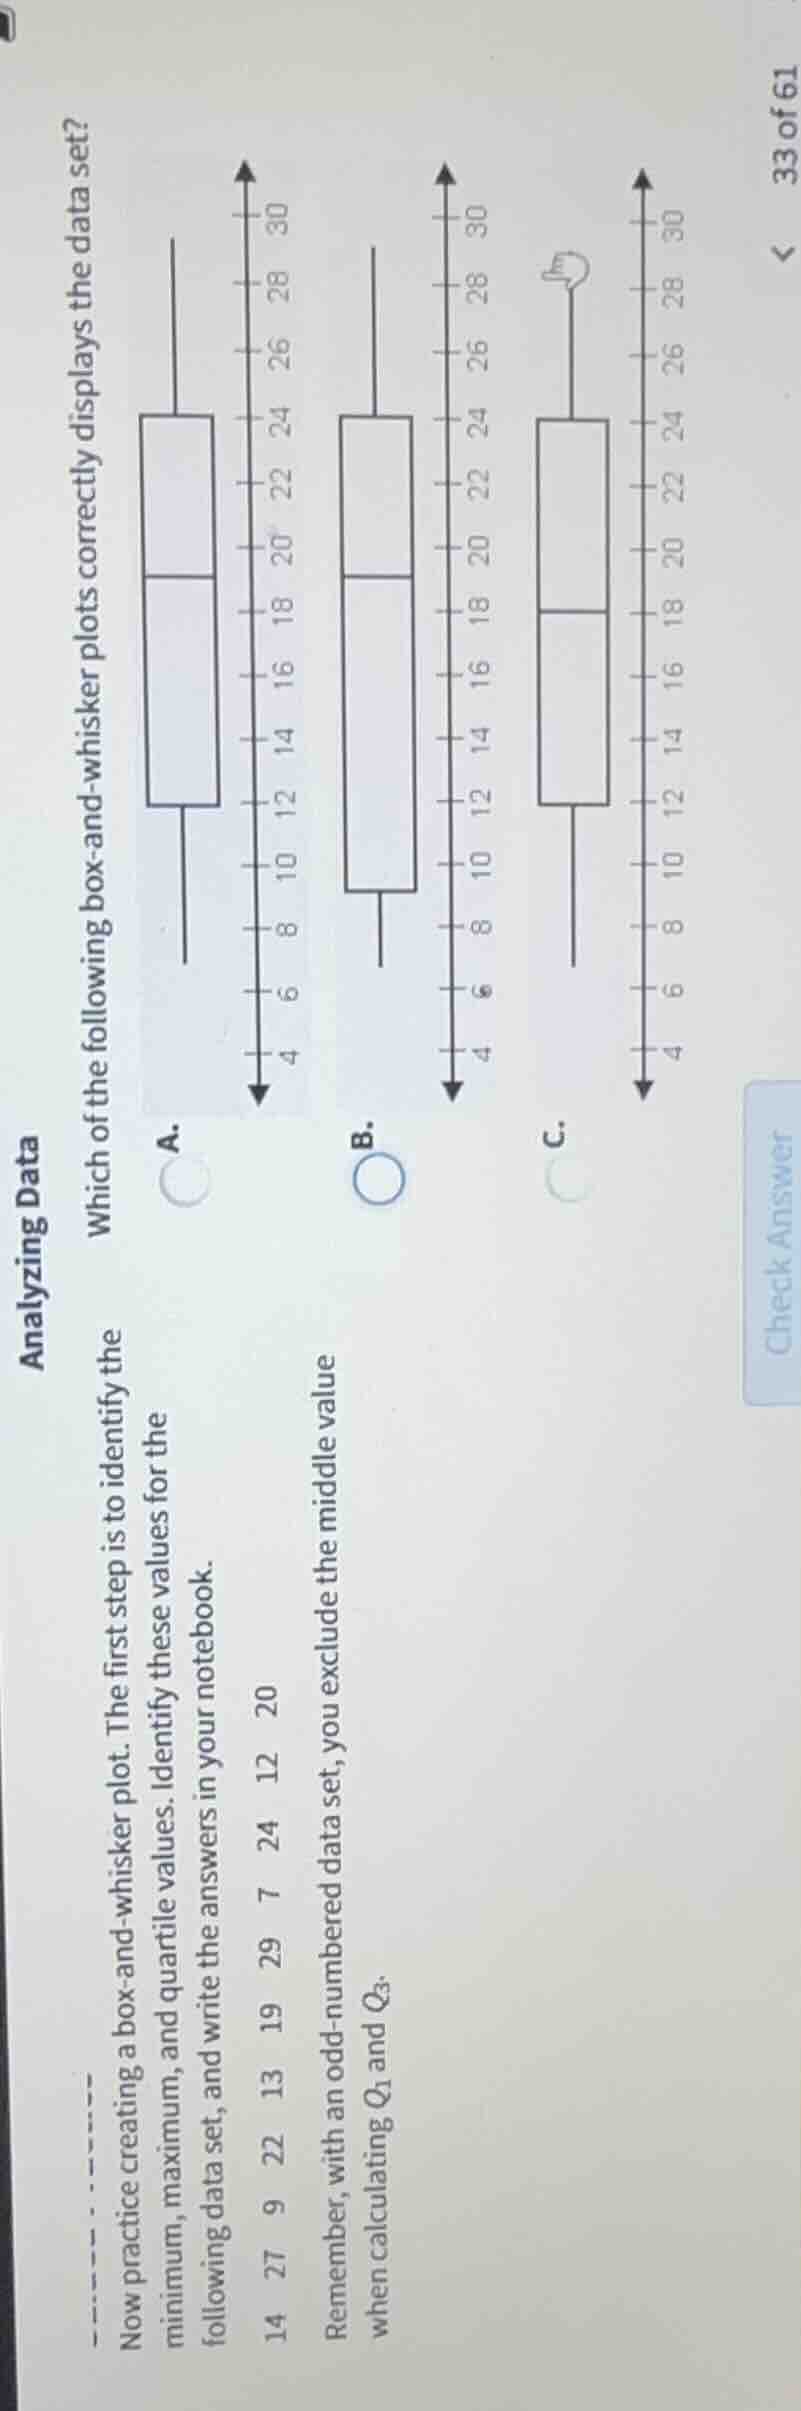
now practice creating a box - and - whisker plot. the first step is to identify the minimum, maximum, and quartile values. identify these values for the following data set, and write the answers in your notebook.
14 27 9 22 13 19 29 7 24 12 20
remember, with an odd - numbered data set, you exclude the middle value when calculating (q_1) and (q_3).
which of the following box - and - whisker plots correctly displays the data set?
a.
box - and - whisker plot a
b.
box - and - whisker plot b
c.
box - and - whisker plot c
Step1: Ordenar los datos
Ordenamos el conjunto: $7, 9, 12, 13, 14, 19, 20, 22, 24, 27, 29$
Step2: Identificar mínimo y máximo
Mínimo = $7$, Máximo = $29$
Step3: Calcular la mediana (Q₂)
Es el valor central: $\text{Mediana} = 19$
Step4: Calcular Q₁ (mitad inferior)
Usamos datos sin la mediana: $7, 9, 12, 13, 14$. Valor central: $Q_1 = 12$
Step5: Calcular Q₃ (mitad superior)
Usamos datos sin la mediana: $20, 22, 24, 27, 29$. Valor central: $Q_3 = 24$
Step6: Coincidir con el gráfico
El gráfico A tiene estos valores: bigote inferior en 7, borde inferior de la caja en 12, línea central en 19, borde superior de la caja en 24, bigote superior en 29.

Snap & solve any problem in the app
Get step-by-step solutions on Sovi AI
Photo-based solutions with guided steps
Explore more problems and detailed explanations
A. The box-and-whisker plot with minimum 7, median 19, maximum 29, Q₁=12, Q₃=24