QUESTION IMAGE
Question
answer attempt 1 out of 5
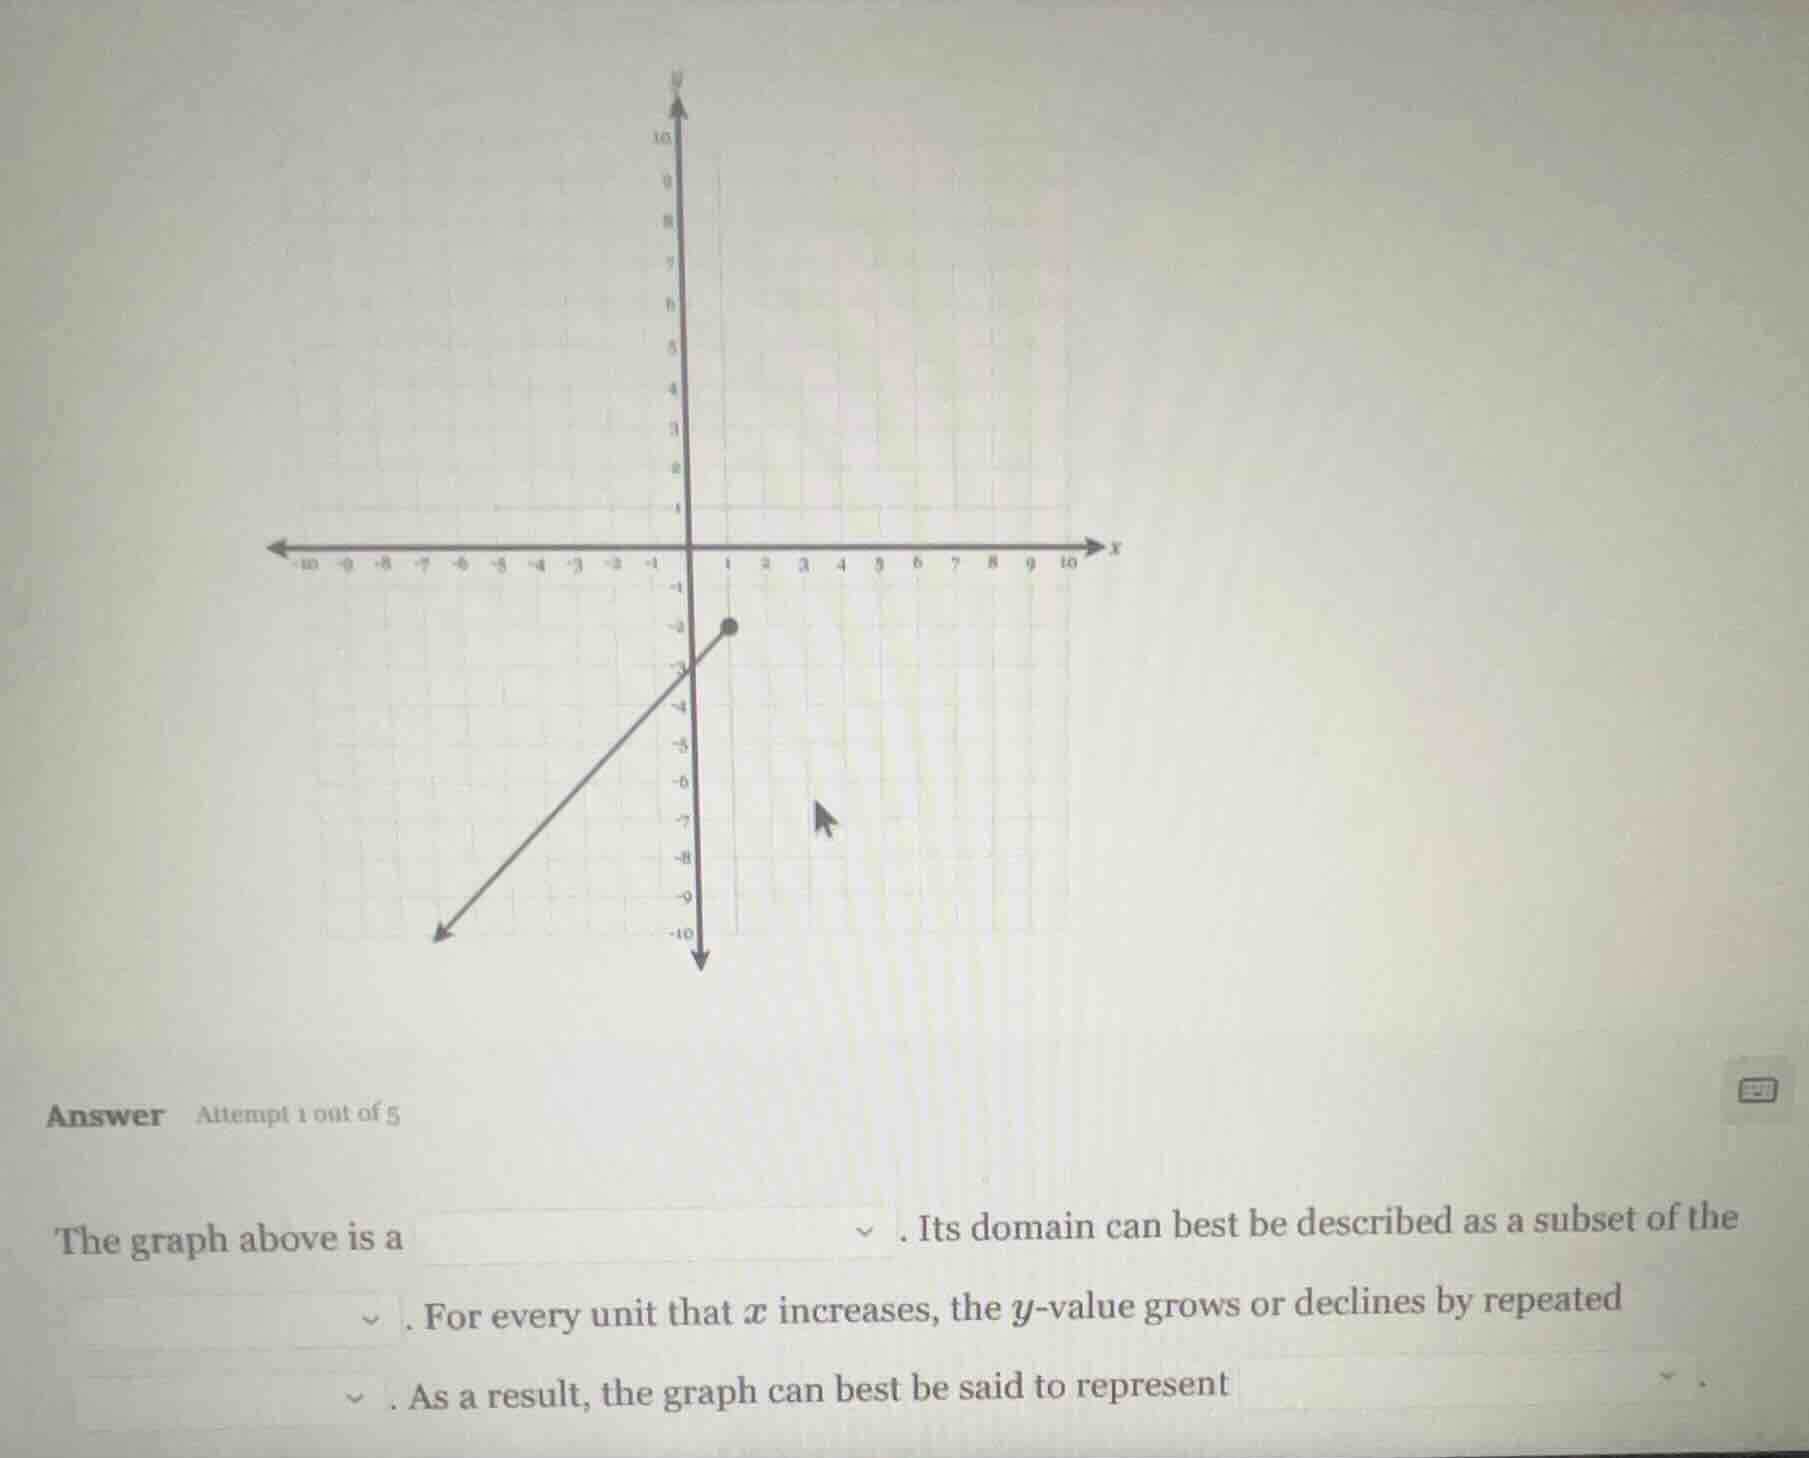
the graph above is a
. its domain can best be described as a subset of the
. for every unit that $x$ increases, the $y$-value grows or declines by repeated
. as a result, the graph can best be said to represent
Step1: Identify graph type
The graph is a straight line segment with one closed endpoint, extending infinitely leftward, so it is a linear function (half-line).
Step2: Determine domain
The graph exists for all $x$ values less than or equal to 1, so the domain is a subset of the real numbers (specifically $x \leq 1$).
Step3: Find rate of change
Use two points: the endpoint $(1, -2)$ and the y-intercept $(0, -3)$. Calculate slope:
$\text{slope} = \frac{-3 - (-2)}{0 - 1} = \frac{-1}{-1} = 1$. For every unit $x$ increases, $y$ increases by 1 (a constant amount, not repeated multiplication).
Step4: Classify the function
It is a linear (non-proportional) function (since it has a y-intercept not at (0,0) and constant slope).

Snap & solve any problem in the app
Get step-by-step solutions on Sovi AI
Photo-based solutions with guided steps
Explore more problems and detailed explanations
The graph above is a linear function (half-line). Its domain can best be described as a subset of the real numbers (all $x \leq 1$). For every unit that $x$ increases, the $y$-value grows or declines by a constant amount of 1. As a result, the graph can best be said to represent a linear (non-proportional) function.