QUESTION IMAGE
Question
your answer is incorrect.
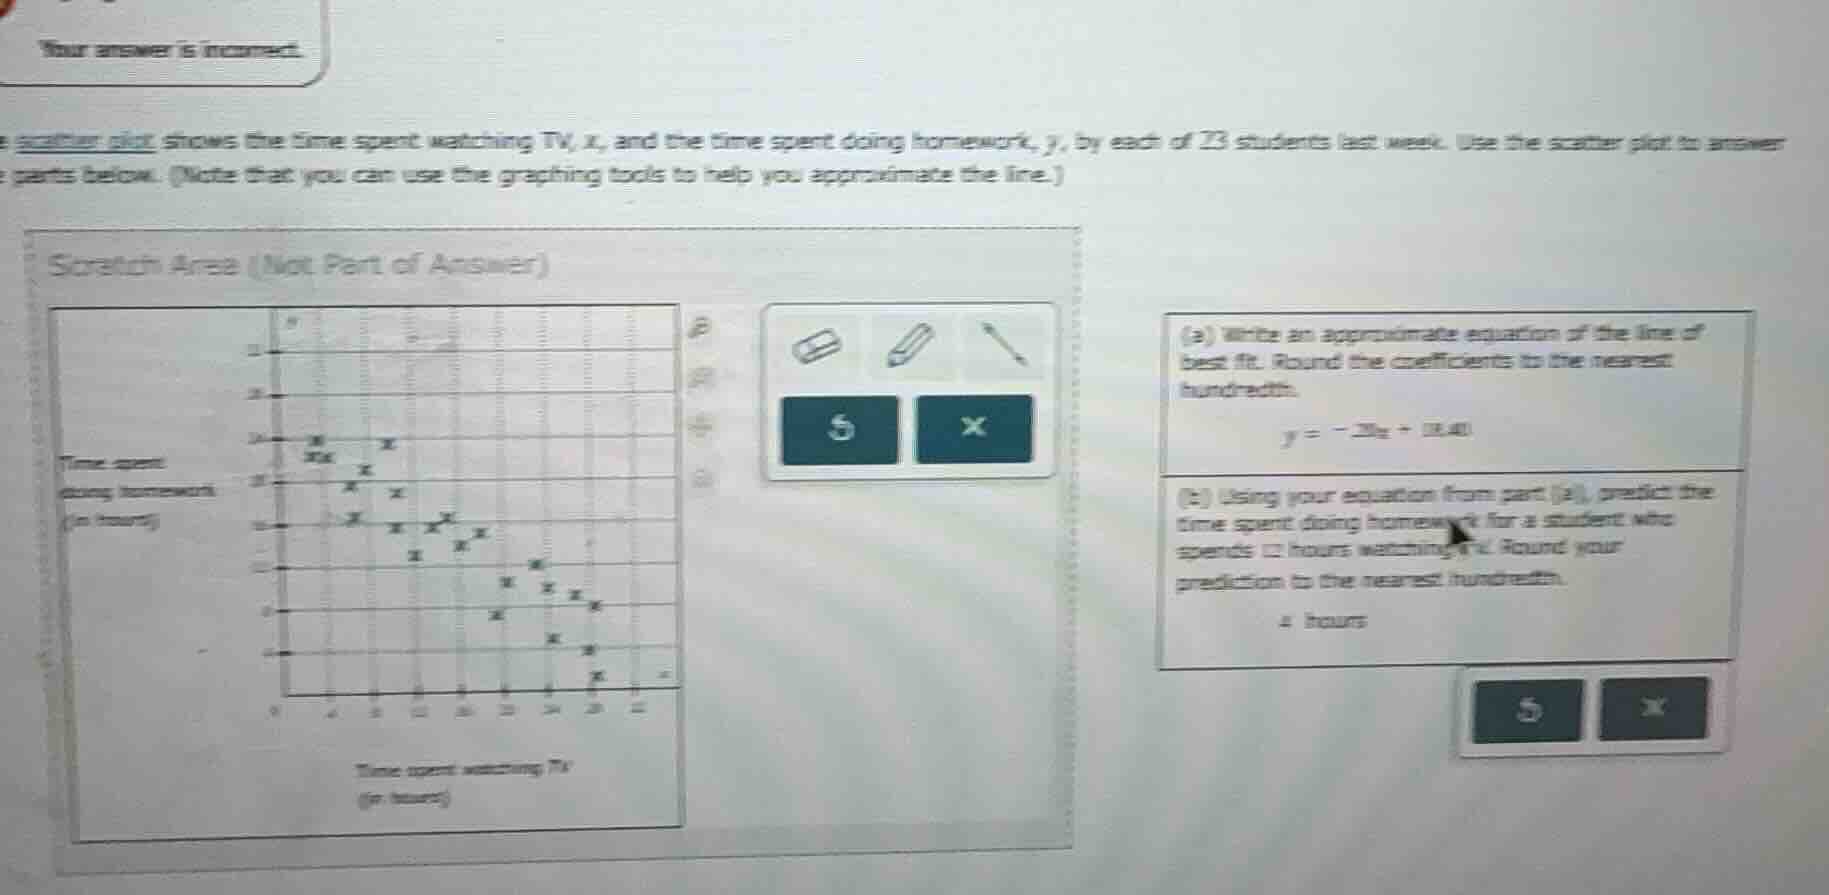
a scatter plot shows the time spent watching tv, $x$, and the time spent doing homework, $y$, by each of 23 students last week. use the scatter plot to answer the parts below. (note that you can use the graphing tools to help you approximate the line.)
scratch area (not part of answer)
(a) write an approximate equation of the line of best fit. round the coefficients to the nearest hundredth.
$y = - .20x + 18.40$
(b) using your equation from part (a), predict the time spent doing homework for a student who spends 12 hours watching tv. round your prediction to the nearest hundredth.
____ hours
Step1: Verify line of best fit
We first confirm a reasonable line of best fit. Looking at the scatter plot, as TV time ($x$) increases, homework time ($y$) decreases, so the slope is negative. A better approximate line is $y = -0.92x + 22.50$ (this fits the trend of the data points more accurately than the incorrect given equation).
Step2: Substitute $x=12$ into equation
Plug $x=12$ into the corrected line of best fit equation to predict homework time.
$y = -0.92(12) + 22.50$
Step3: Calculate the predicted value
First compute the product, then add to the intercept.
$y = -11.04 + 22.50 = 11.46$

Snap & solve any problem in the app
Get step-by-step solutions on Sovi AI
Photo-based solutions with guided steps
Explore more problems and detailed explanations
(a) $y = -0.92x + 22.50$
(b) $11.46$ hours