QUESTION IMAGE
Question
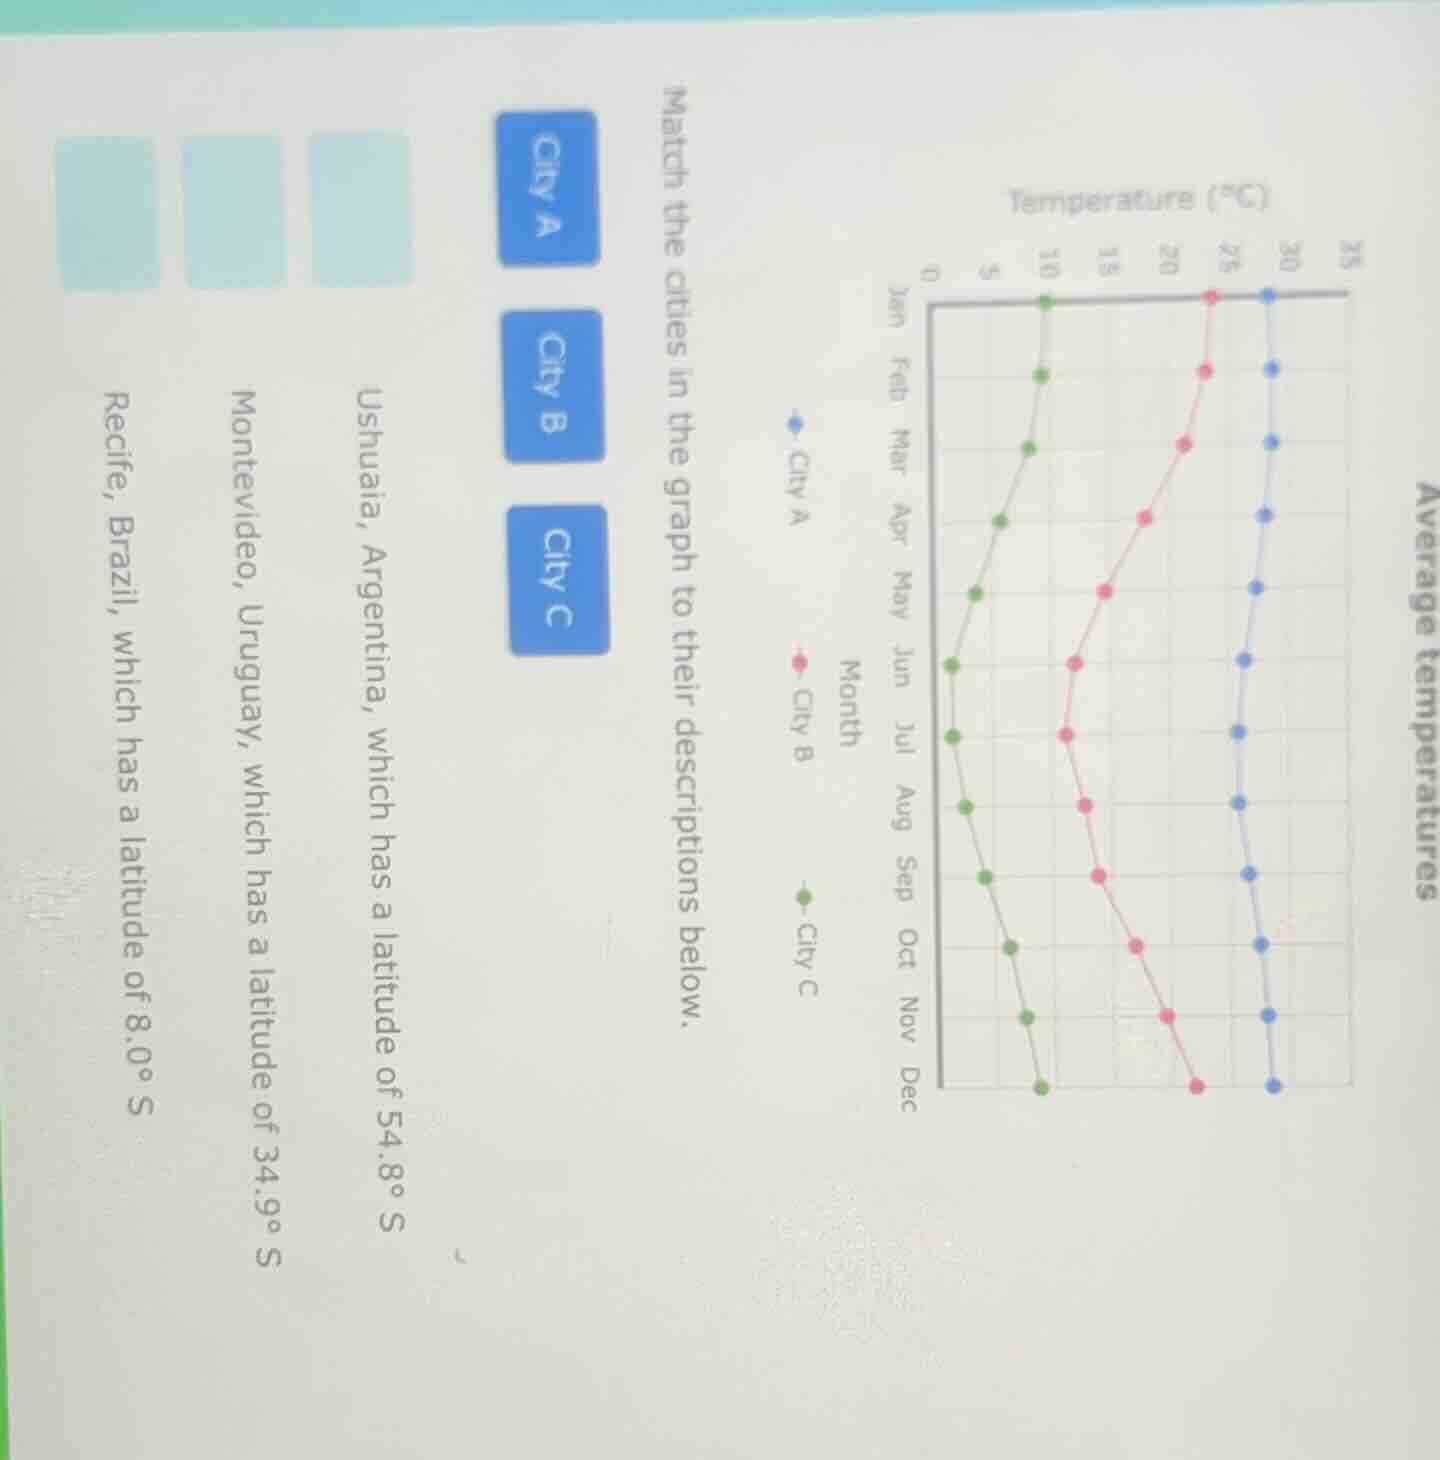
average temperatures
match the cities in the graph to their descriptions below.
city a
city b
city c
ushuaia, argentina, which has a latitude of 54.8° s
montevideo, uruguay, which has a latitude of 34.9° s
recife, brazil, which has a latitude of 8.0° s
To solve this, we analyze the temperature graphs and latitudes:
Step 1: Understand Latitude and Seasonal Temperature
Cities in the Southern Hemisphere (all three here) have winter in June–August (cooler months) and summer in December–February (warmer months). The closer a city is to the equator (lower latitude, e.g., Recife at \( 8.0^\circ \text{S} \)), the smaller the temperature variation (more tropical, consistent warmth). The farther from the equator (higher latitude, e.g., Ushuaia at \( 54.8^\circ \text{S} \)), the larger the temperature variation (colder winters, warmer summers).
Step 2: Analyze Temperature Curves
- City A (blue): Highest average temperatures (close to \( 30^\circ \text{C} \) in Jan/Dec, minimal variation). This matches Recife (\( 8.0^\circ \text{S} \)) (low latitude, tropical climate).
- City B (red): Moderate temperature variation (peaks ~\( 25^\circ \text{C} \) in Jan/Dec, dips ~\( 15^\circ \text{C} \) in Jun/Jul). This matches Montevideo (\( 34.9^\circ \text{S} \)) (mid-latitude, temperate climate).
- City C (green): Largest temperature variation (peaks ~\( 10^\circ \text{C} \) in Jan/Dec, dips to ~\( 0^\circ \text{C} \) in Jun/Jul). This matches Ushuaia (\( 54.8^\circ \text{S} \)) (high latitude, polar-influenced climate).

Snap & solve any problem in the app
Get step-by-step solutions on Sovi AI
Photo-based solutions with guided steps
Explore more problems and detailed explanations
- City A: Recife, Brazil (latitude \( 8.0^\circ \text{S} \))
- City B: Montevideo, Uruguay (latitude \( 34.9^\circ \text{S} \))
- City C: Ushuaia, Argentina (latitude \( 54.8^\circ \text{S} \))