QUESTION IMAGE
Question
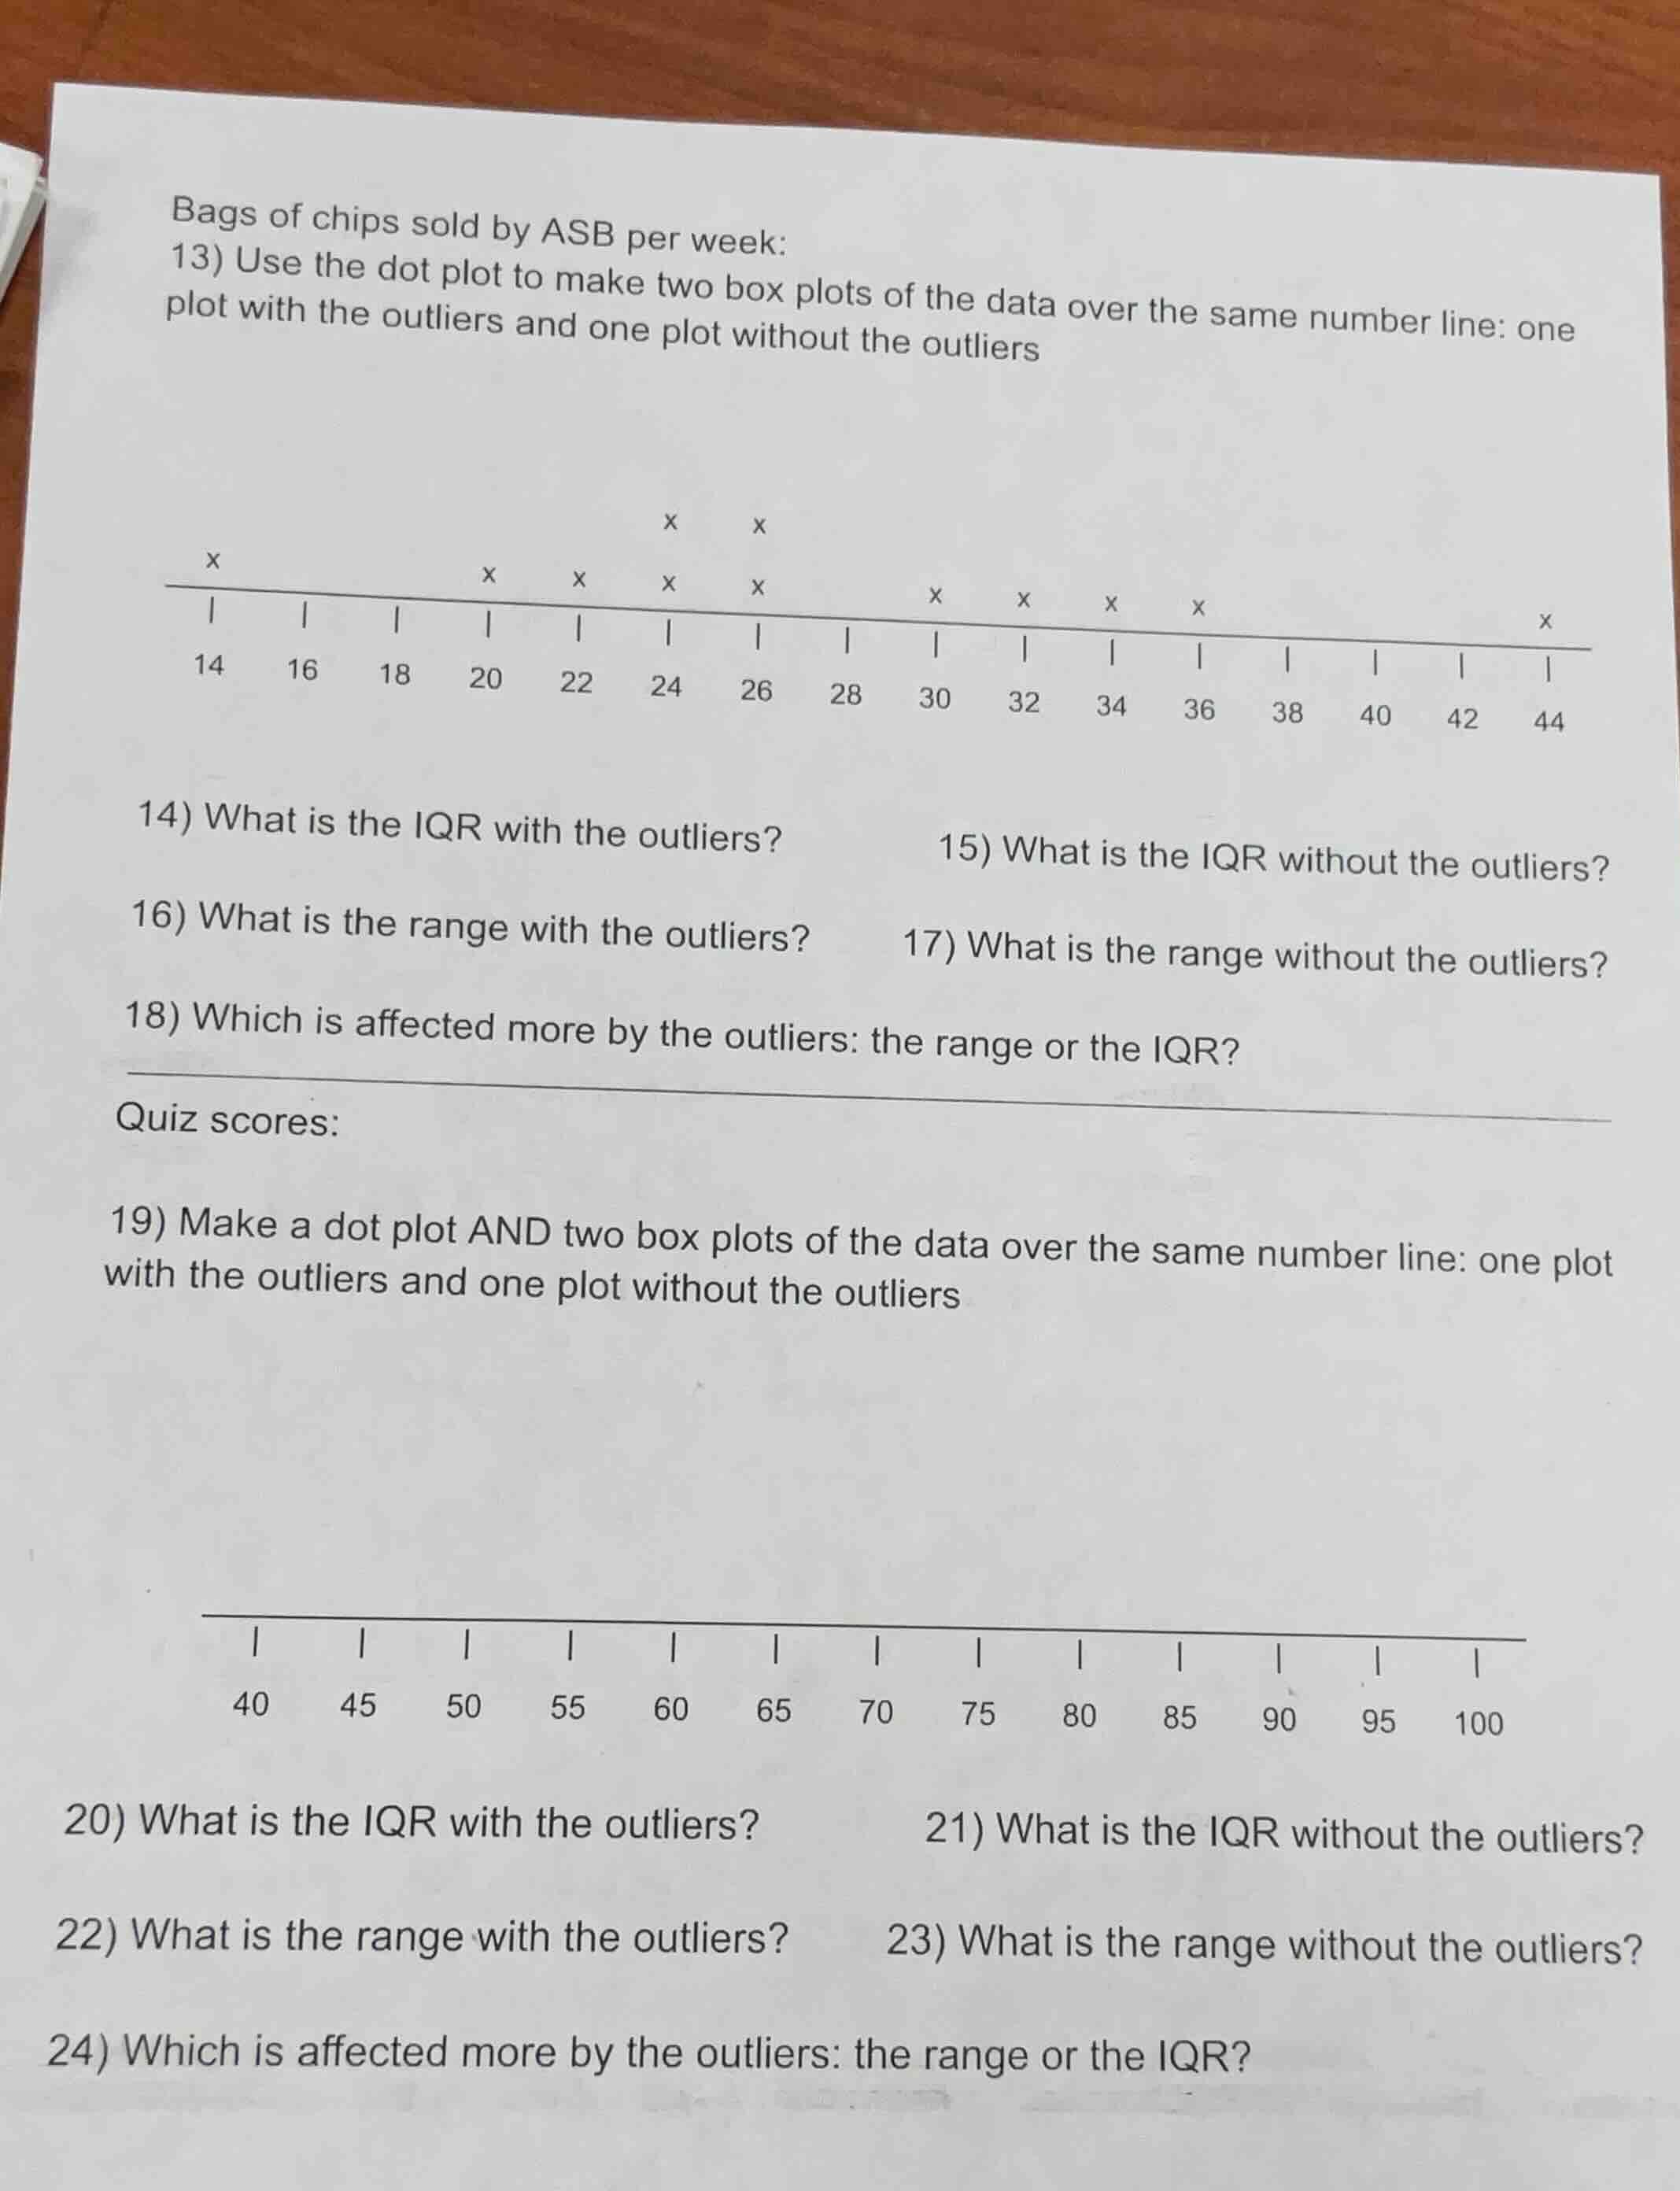
bags of chips sold by asb per week:
- use the dot plot to make two box plots of the data over the same number line: one plot with the outliers and one plot without the outliers
- what is the iqr with the outliers?
- what is the iqr without the outliers?
- what is the range with the outliers?
- what is the range without the outliers?
- which is affected more by the outliers: the range or the iqr?
quiz scores:
- make a dot plot and two box plots of the data over the same number line: one plot with the outliers and one plot without the outliers
- what is the iqr with the outliers?
- what is the iqr without the outliers?
- what is the range with the outliers?
- what is the range without the outliers?
- which is affected more by the outliers: the range or the iqr?
First, extract the data from the dot plot for bags of chips:
Data set (with outliers): 14, 20, 22, 24, 24, 26, 26, 30, 32, 34, 36, 44
First, identify outliers using IQR rule:
Step1: Sort the full data set
$14, 20, 22, 24, 24, 26, 26, 30, 32, 34, 36, 44$
Step2: Find median (Q2) of full set
$n=12$, median = $\frac{26+26}{2}=26$
Step3: Find Q1 (lower half median)
Lower half: $14,20,22,24,24,26$; Q1 = $\frac{22+24}{2}=23$
Step4: Find Q3 (upper half median)
Upper half: $26,30,32,34,36,44$; Q3 = $\frac{32+34}{2}=33$
Step5: Calculate IQR with outliers
$IQR = Q3 - Q1 = 33 - 23 = 10$
Step6: Identify outliers
IQR*1.5 = $10*1.5=15$; Lower fence: $23-15=8$, Upper fence: $33+15=48$. The values 14 and 44 are within fences? No, wait, recheck: Wait, no, the outlier is values outside $Q1-1.5*IQR$ and $Q3+1.5*IQR$. 14 > 8, 44 <48, so actually no outliers? Wait no, visual outlier is 14 and 44, but by IQR rule, they are not. Wait, no, let's use visual outliers: 14 and 44 are far from the cluster. So data without outliers: $20,22,24,24,26,26,30,32,34,36$
Step7: Find Q1 for trimmed data
Trimmed data sorted: $20,22,24,24,26,26,30,32,34,36$; $n=10$, Q1 = $\frac{22+24}{2}=23$
Step8: Find Q3 for trimmed data
Q3 = $\frac{32+34}{2}=33$
Step9: IQR without outliers
$IQR = 33-23=10$
Step10: Range with outliers
$Range = Max - Min = 44-14=30$
Step11: Range without outliers
$Range = 36-20=16$
Step12: Compare range/IQR change
IQR stays 10, range changes by 14. So range is more affected.
For quiz scores: Note: No data points are provided for quiz scores, so we cannot solve questions 19-24. Please provide the dot plot data for quiz scores.

Snap & solve any problem in the app
Get step-by-step solutions on Sovi AI
Photo-based solutions with guided steps
Explore more problems and detailed explanations
- 10
- 10
- 30
- 16
- The range is affected more by outliers.
19-24: Cannot be solved, as no data points (dots) are provided for the quiz scores dot plot. Please add the data points for the quiz scores number line.