QUESTION IMAGE
Question
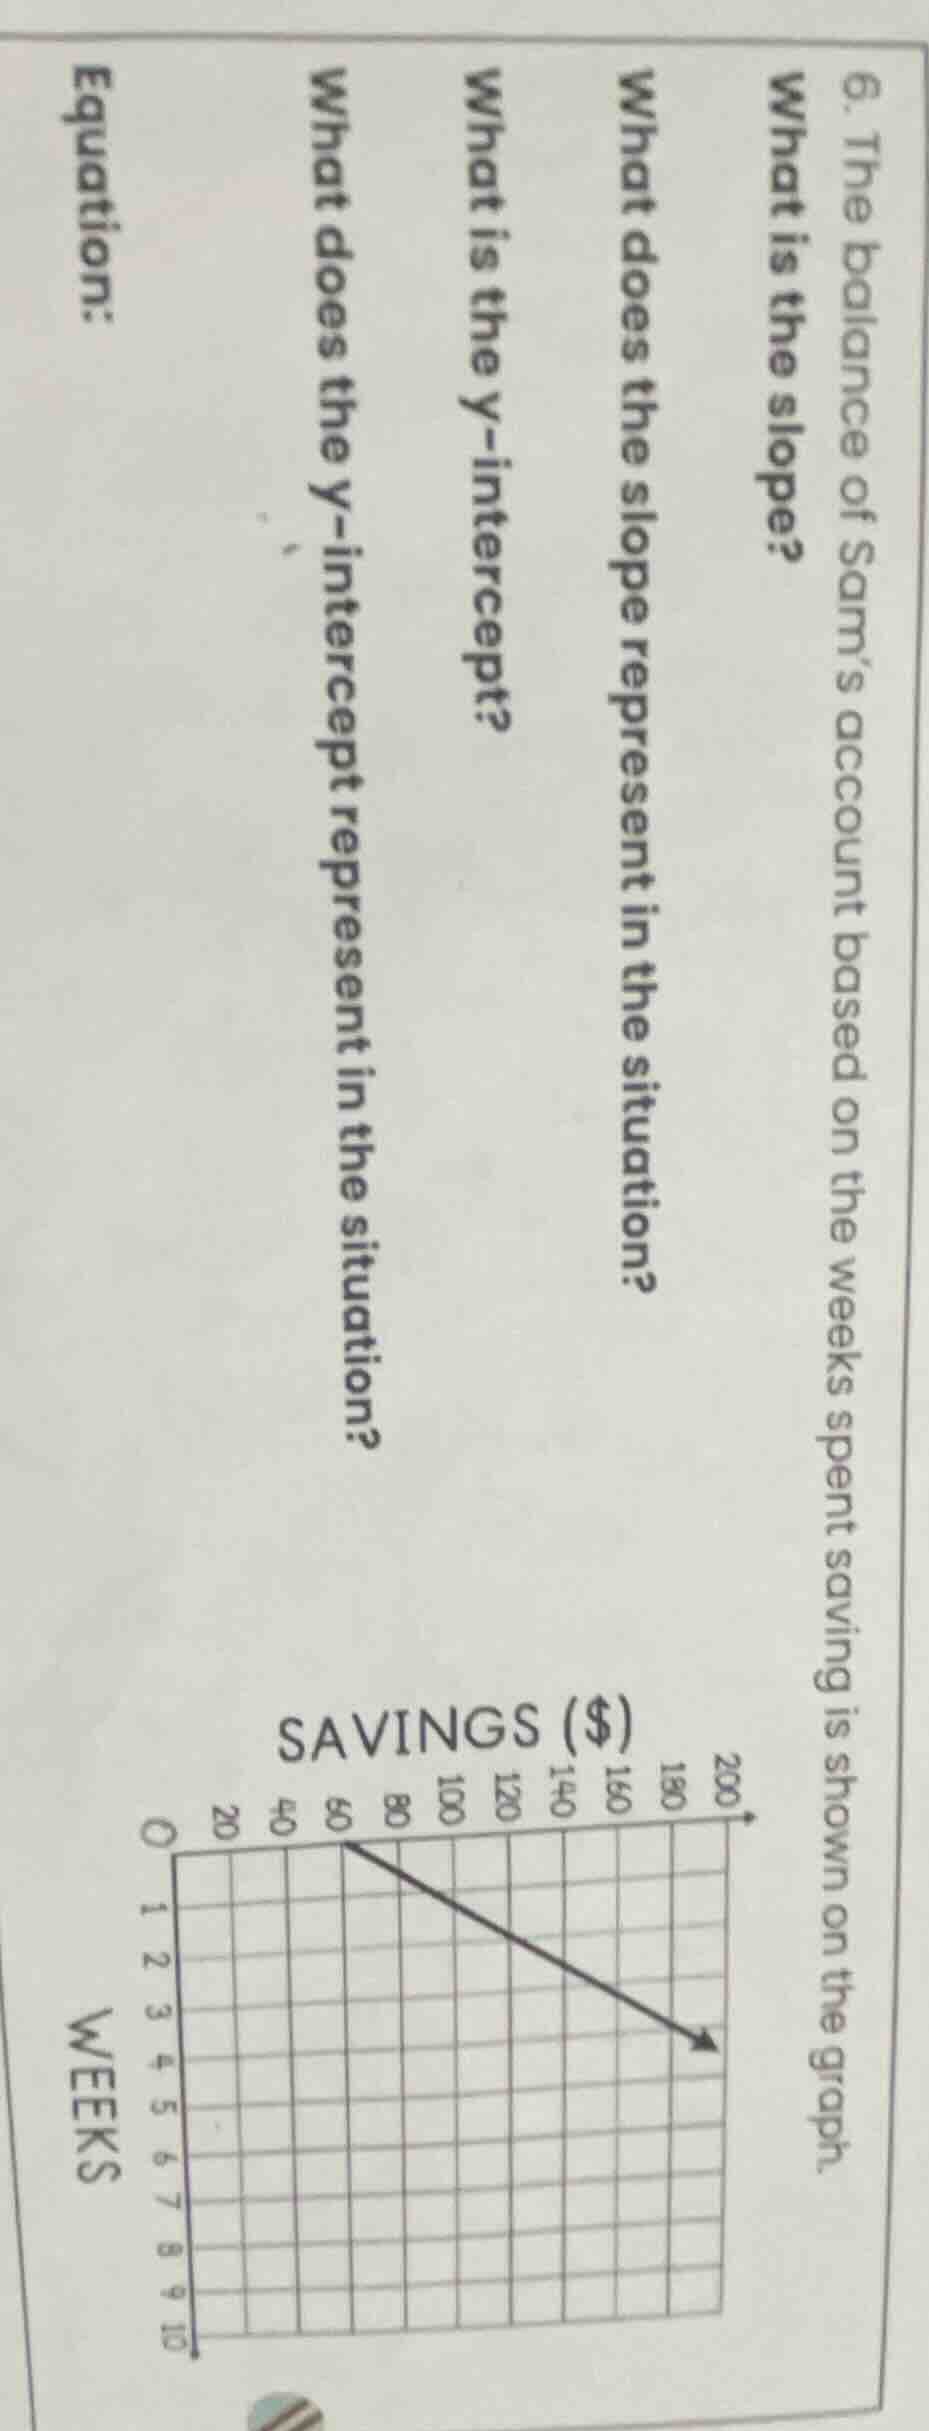
- the balance of sam’s account based on the weeks spent saving is shown on the graph.
what is the slope?
what does the slope represent in the situation?
what is the y - intercept?
what does the y - intercept represent in the situation?
equation:
graph titled savings ($) with x - axis (weeks) from 0 to 10 and y - axis (savings ($)) from 0 to 200, showing a line starting at (0, 60) and going to (4, 160) (approximate based on grid)
Step1: Identify graph points
Points: $(0, 60)$ and $(7, 200)$
Step2: Calculate slope
$\text{slope} = \frac{200 - 60}{7 - 0} = \frac{140}{7} = 20$
Step3: Identify y-intercept
Y-intercept is the y-value at $x=0$: $60$
Step4: Interpret slope
Slope = $\frac{\text{Change in savings}}{\text{Change in weeks}}$, so it is the amount saved per week.
Step5: Interpret y-intercept
At $x=0$ (0 weeks saving), the value is the starting balance.
Step6: Write linear equation
Use $y = mx + b$, where $m=20$, $b=60$: $y = 20x + 60$

Snap & solve any problem in the app
Get step-by-step solutions on Sovi AI
Photo-based solutions with guided steps
Explore more problems and detailed explanations
- Slope: 20
- Slope representation: Weekly savings amount
- y-intercept: 60
- y-intercept representation: Initial account balance
- Equation: $y = 20x + 60$