QUESTION IMAGE
Question
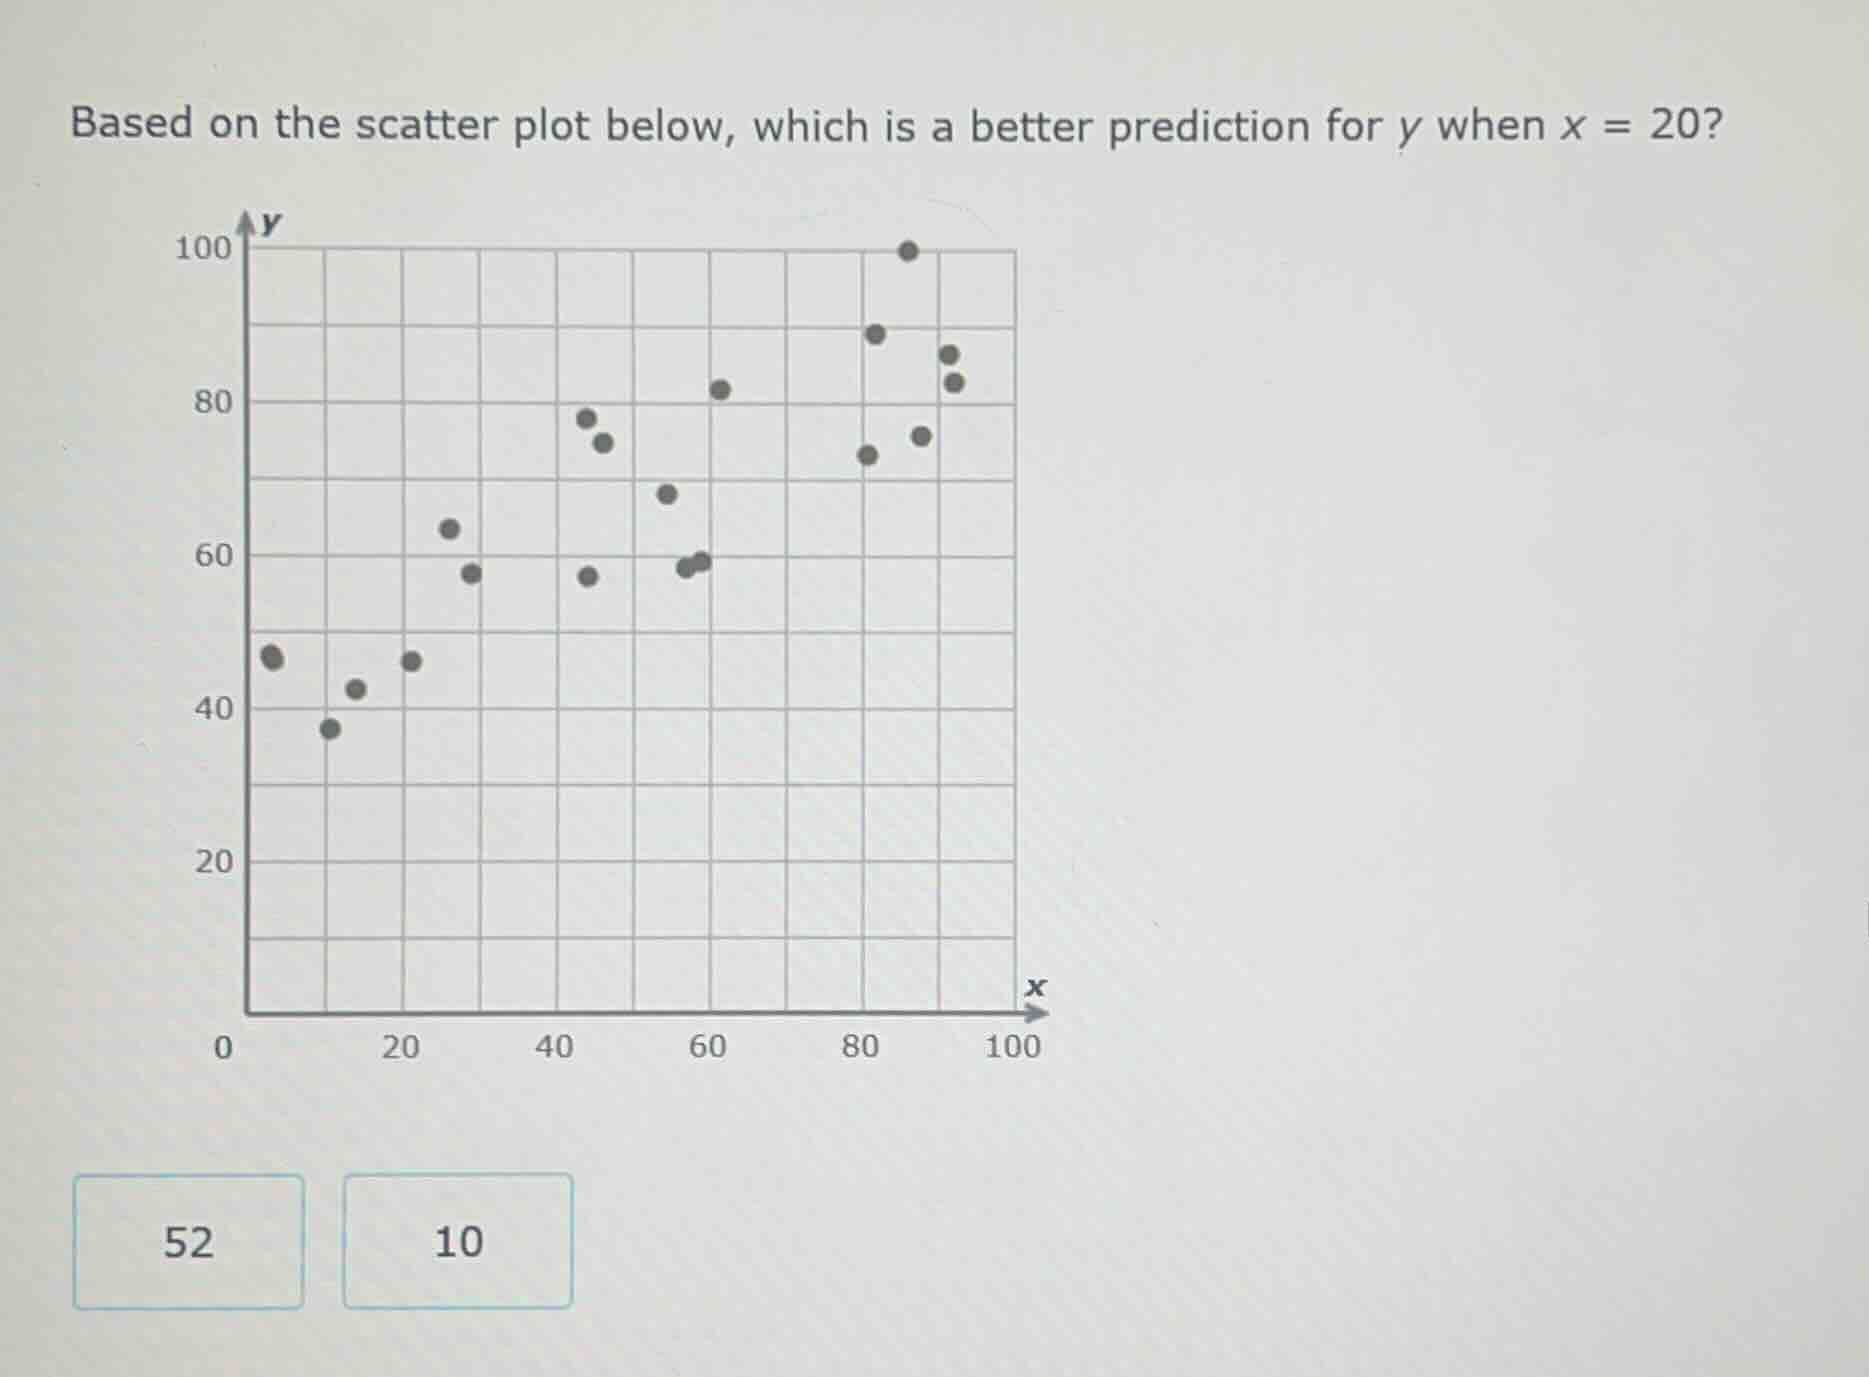
based on the scatter plot below, which is a better prediction for y when x = 20?
52
10
Step1: Analyze scatter plot trend
Observe that as $x$ increases, $y$ generally increases (positive correlation).
Step2: Check x=20 data points
At $x=20$, the plotted $y$-values are around 45-65.
Step3: Evaluate given predictions
10 is far below the observed range for $x=20$, while 52 falls within the typical $y$-value range for this $x$.

Snap & solve any problem in the app
Get step-by-step solutions on Sovi AI
Photo-based solutions with guided steps
Explore more problems and detailed explanations
52