QUESTION IMAGE
Question
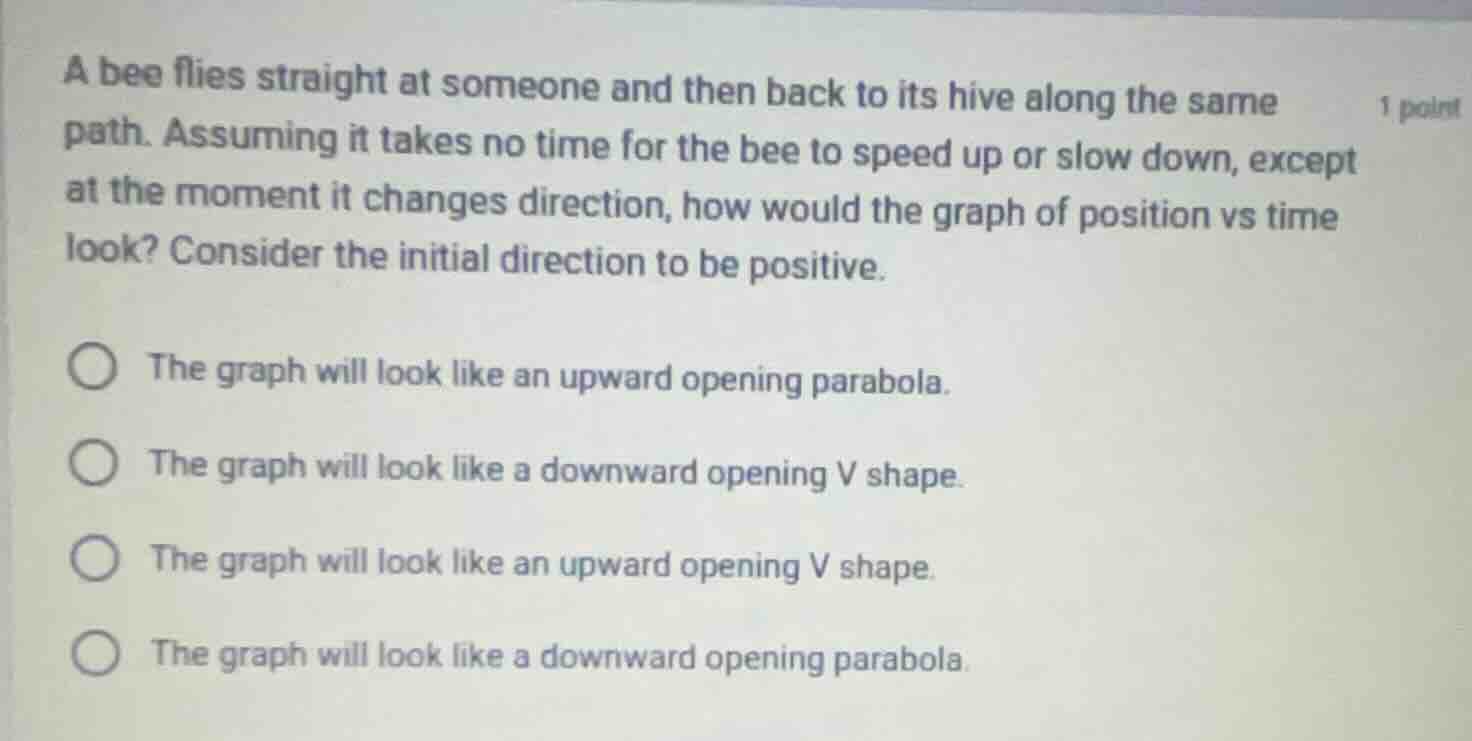
a bee flies straight at someone and then back to its hive along the same path. assuming it takes no time for the bee to speed up or slow down, except at the moment it changes direction, how would the graph of position vs time look? consider the initial direction to be positive. the graph will look like an upward opening parabola. the graph will look like a downward opening v shape. the graph will look like an upward opening v shape. the graph will look like a downward opening parabola.
Brief Explanations
- When the bee flies toward the person (positive direction) at constant speed, position vs. time is a straight line with a positive slope (position increases linearly with time).
- When the bee turns around instantly and flies back to the hive (negative direction) at constant speed, position vs. time is a straight line with a negative slope (position decreases linearly with time).
- Combining these two segments creates a V-shape. Since the slope goes from positive to negative, the V opens downward. Parabolas would represent changing speed (acceleration), which does not apply here as the bee moves at constant speed except for the instantaneous direction change.

Snap & solve any problem in the app
Get step-by-step solutions on Sovi AI
Photo-based solutions with guided steps
Explore more problems and detailed explanations
The graph will look like a downward opening V shape.