QUESTION IMAGE
Question
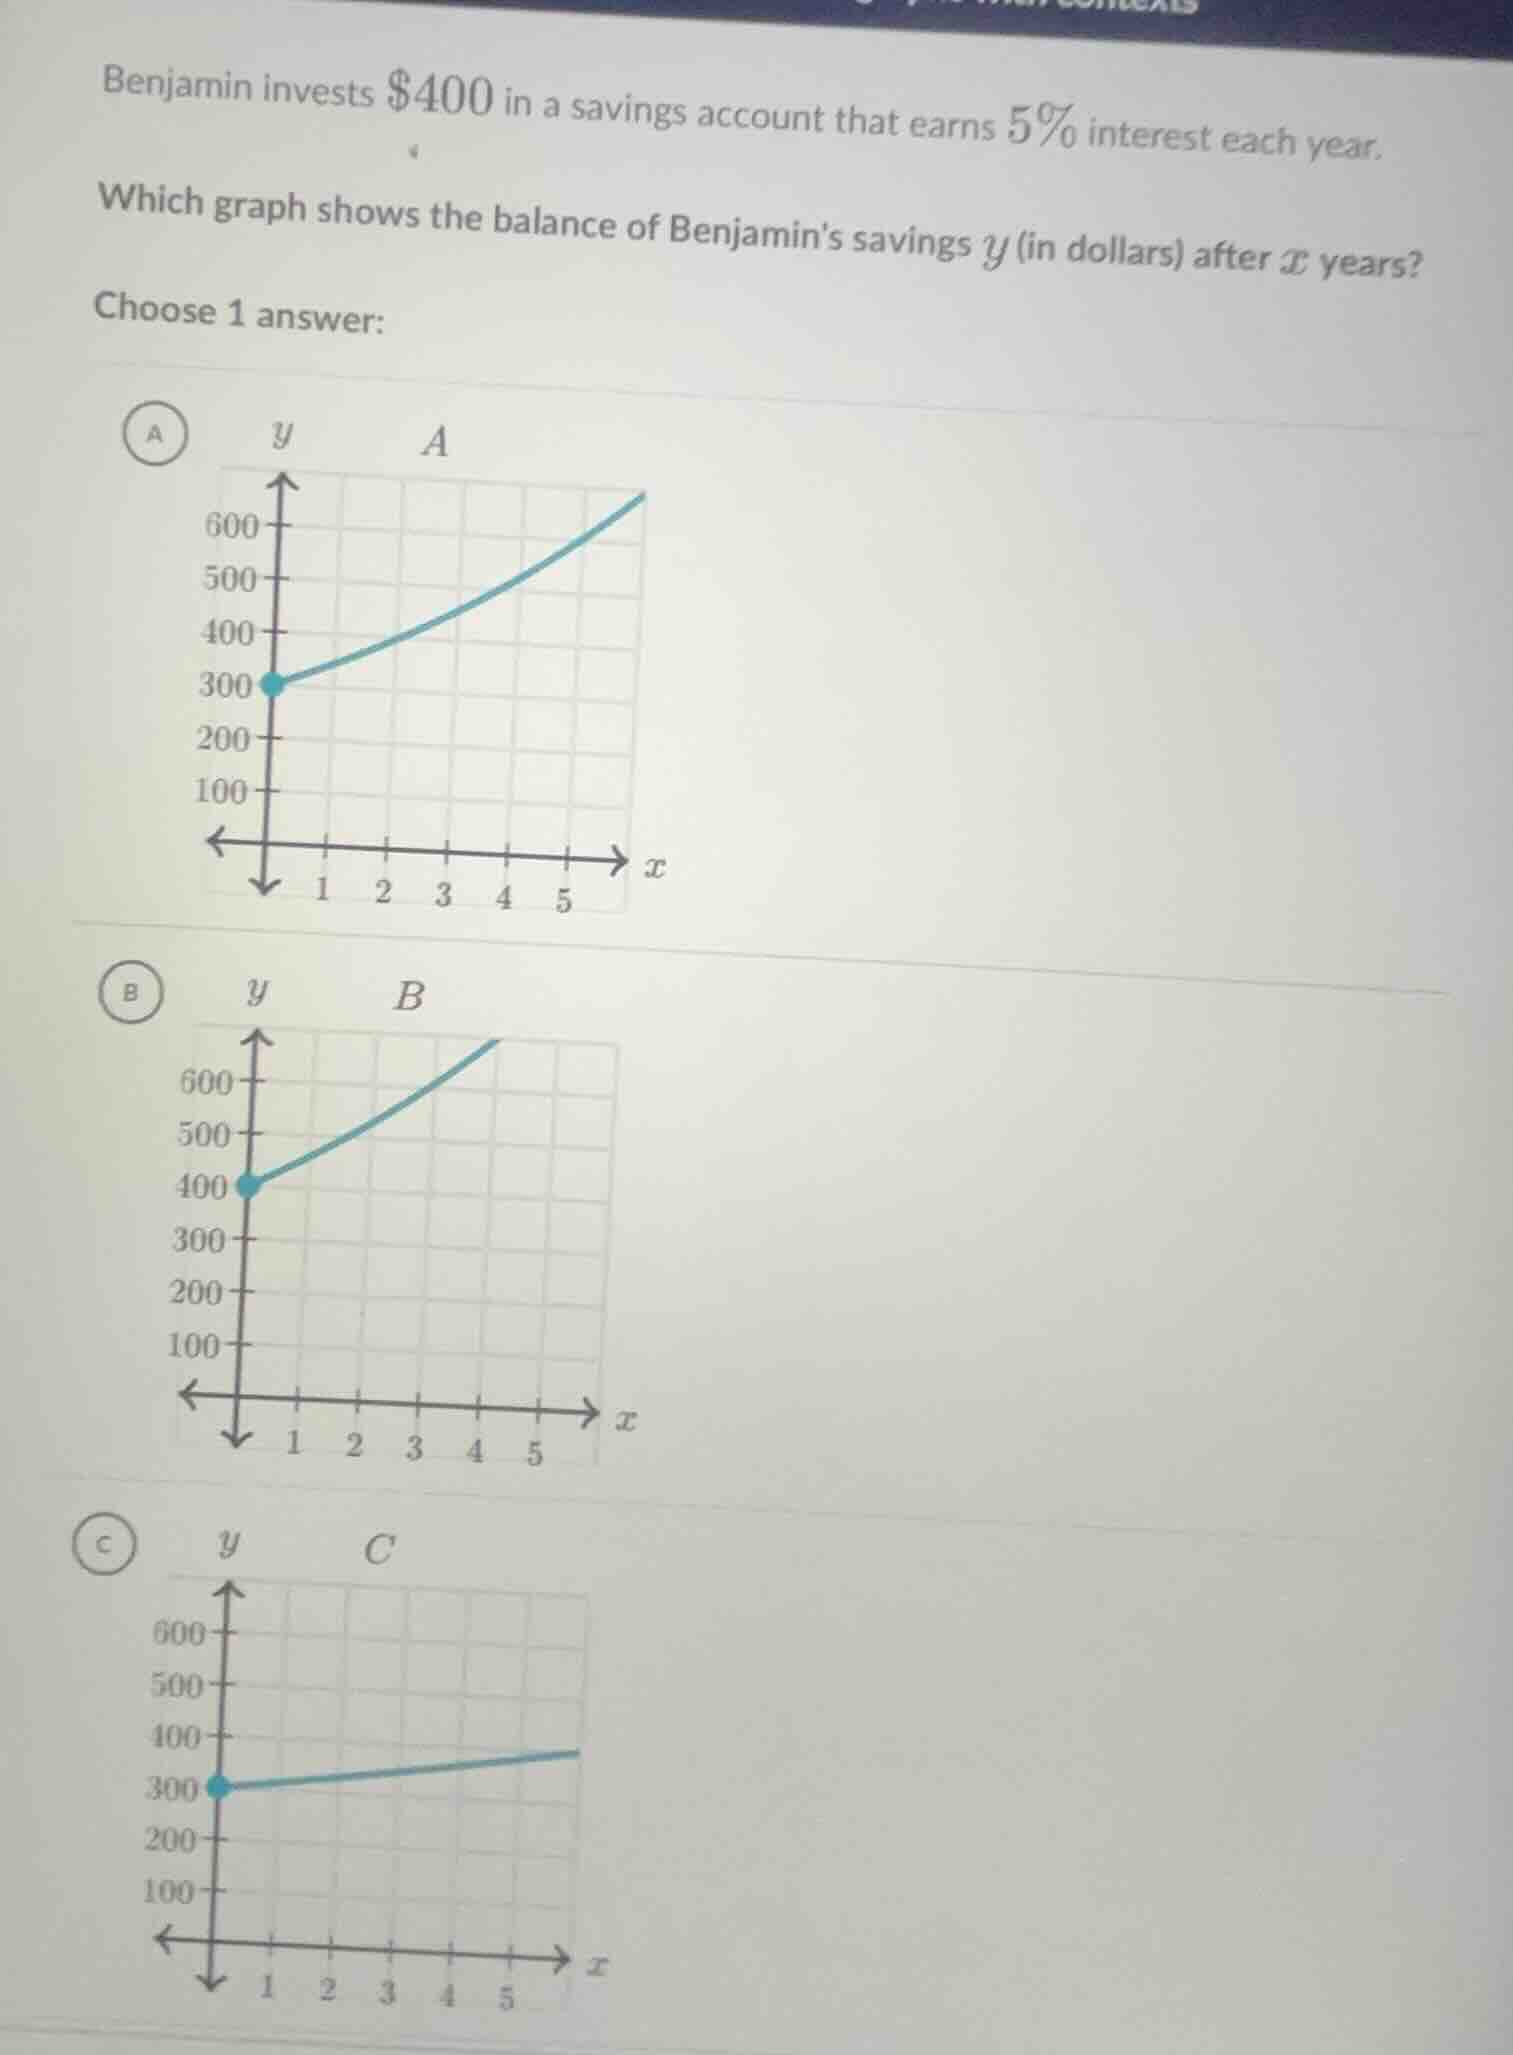
benjamin invests $400 in a savings account that earns 5% interest each year. which graph shows the balance of benjamins savings y (in dollars) after x years? choose 1 answer:
Step1: Identify initial value
The initial investment is $\$400$, so when $x=0$, $y=400$. This eliminates graphs A and C, which start at $y=300$.
Step2: Identify growth type
This is compound interest, so the balance follows an exponential growth model:
$$y = 400(1 + 0.05)^x = 400(1.05)^x$$
Exponential growth produces a curve that increases at an increasing rate, which matches graph B.
Step3: Verify 1-year balance
Calculate balance after 1 year:
$$y = 400 \times 1.05 = 420$$
Graph B shows a value greater than 400 at $x=1$, consistent with this calculation.

Snap & solve any problem in the app
Get step-by-step solutions on Sovi AI
Photo-based solutions with guided steps
Explore more problems and detailed explanations
B. The graph starting at (0, 400) with an upward-curving line rising to over 600 at x=5