QUESTION IMAGE
Question
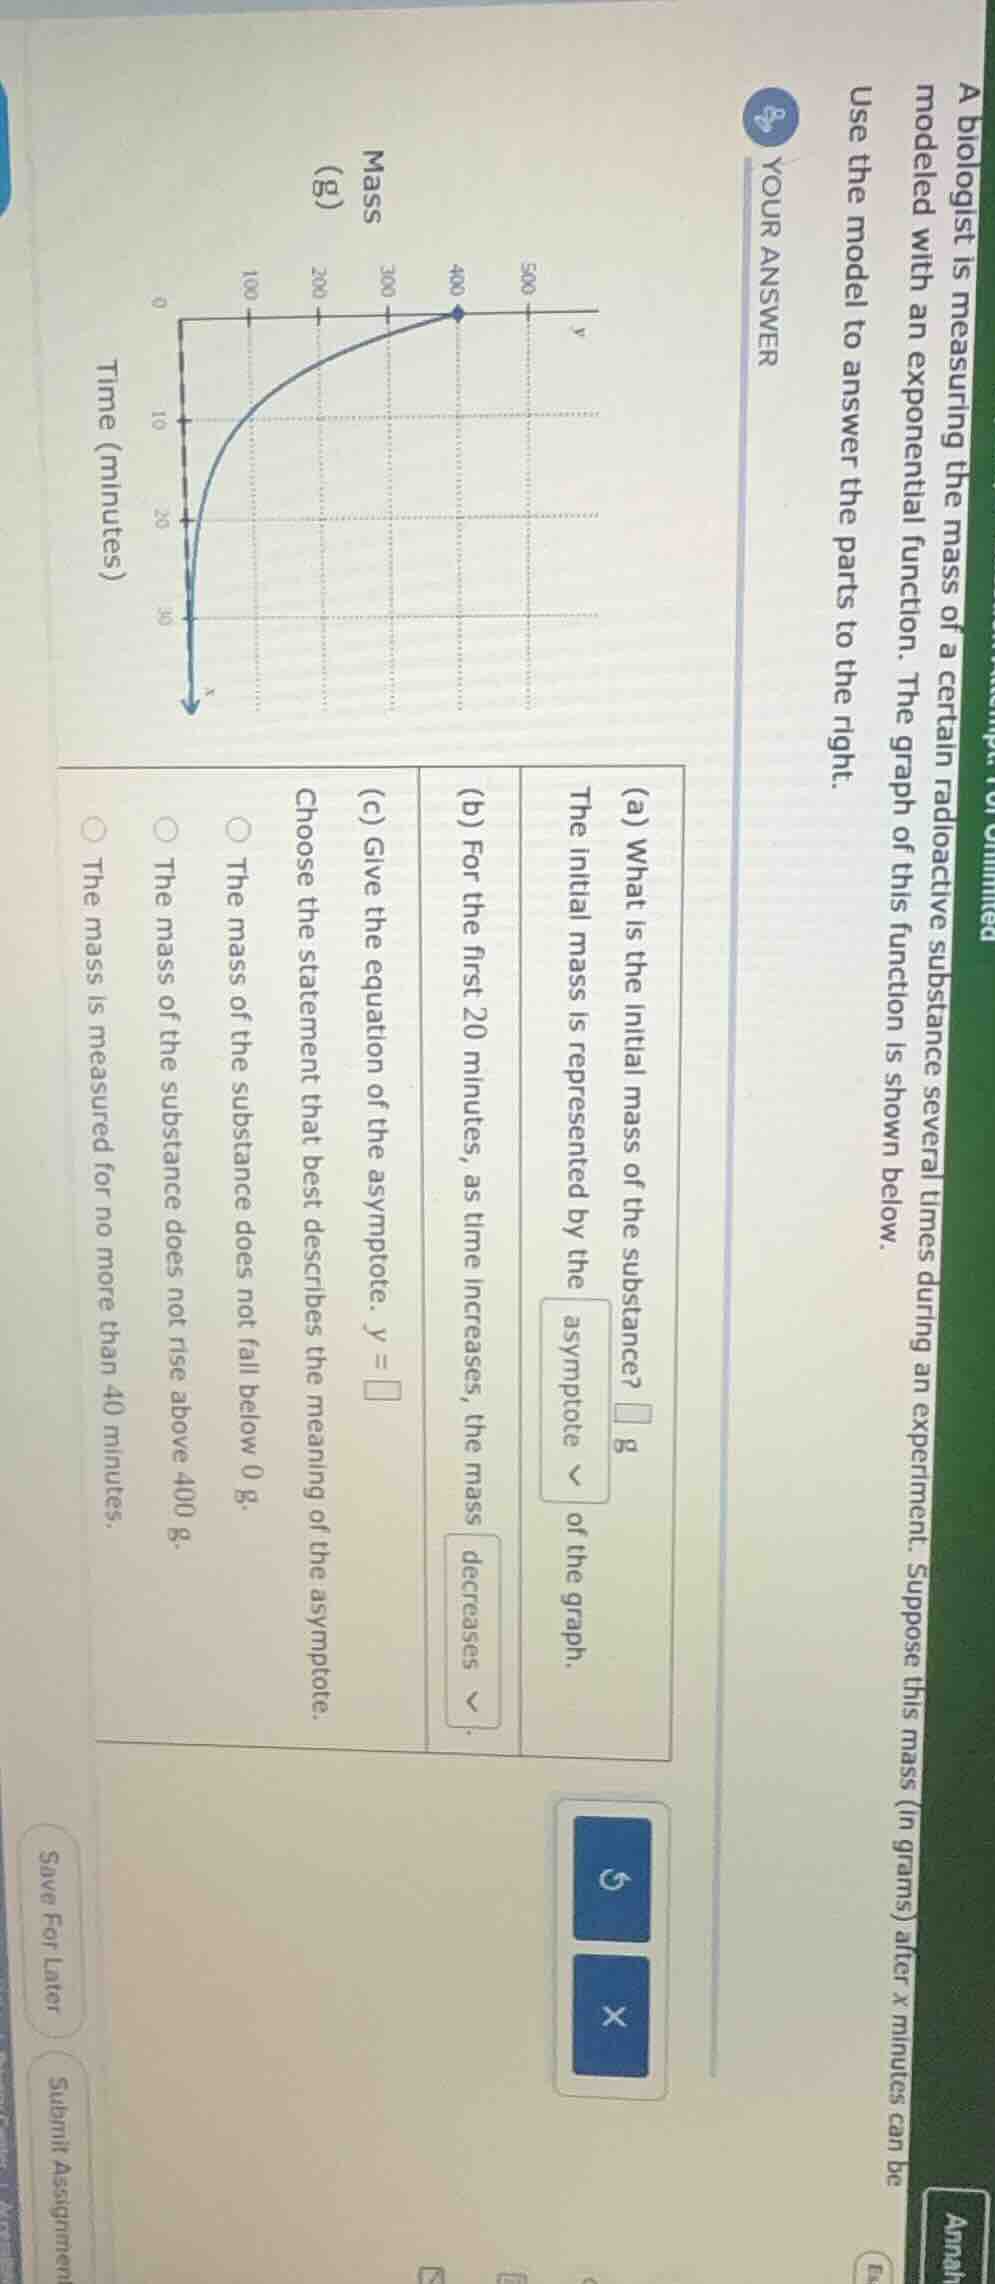
a biologist is measuring the mass of a certain radioactive substance several times during an experiment. suppose this mass (in grams) after x minutes can be modeled with an exponential function. the graph of this function is shown below. use the model to answer the parts to the right. (a) what is the initial mass of the substance? \\(\square\\) g the initial mass is represented by the asymptote of the graph. (b) for the first 20 minutes, as time increases, the mass decreases. (c) give the equation of the asymptote. \\(y = \square\\) choose the statement that best describes the meaning of the asymptote. \\(\circ\\) the mass of the substance does not fall below 0 g. \\(\circ\\) the mass of the substance does not rise above 400 g. \\(\circ\\) the mass is measured for no more than 40 minutes.
Step1: Identify initial mass
The graph starts at $x=0$ (time=0 minutes) with $y=400$ g. This is the initial mass.
Step2: Identify asymptote behavior
The curve approaches $y=0$ as $x$ increases, so the asymptote is $y=0$. The asymptote represents the lower limit of the mass, since mass cannot be negative.
Step3: Match asymptote meaning
The asymptote $y=0$ means the mass will never fall below 0 grams, as exponential decay approaches but never reaches 0.

Snap & solve any problem in the app
Get step-by-step solutions on Sovi AI
Photo-based solutions with guided steps
Explore more problems and detailed explanations
(a) 400; horizontal
(b) decreases
(c) $y=0$
The mass of the substance does not fall below 0 g.