QUESTION IMAGE
Question
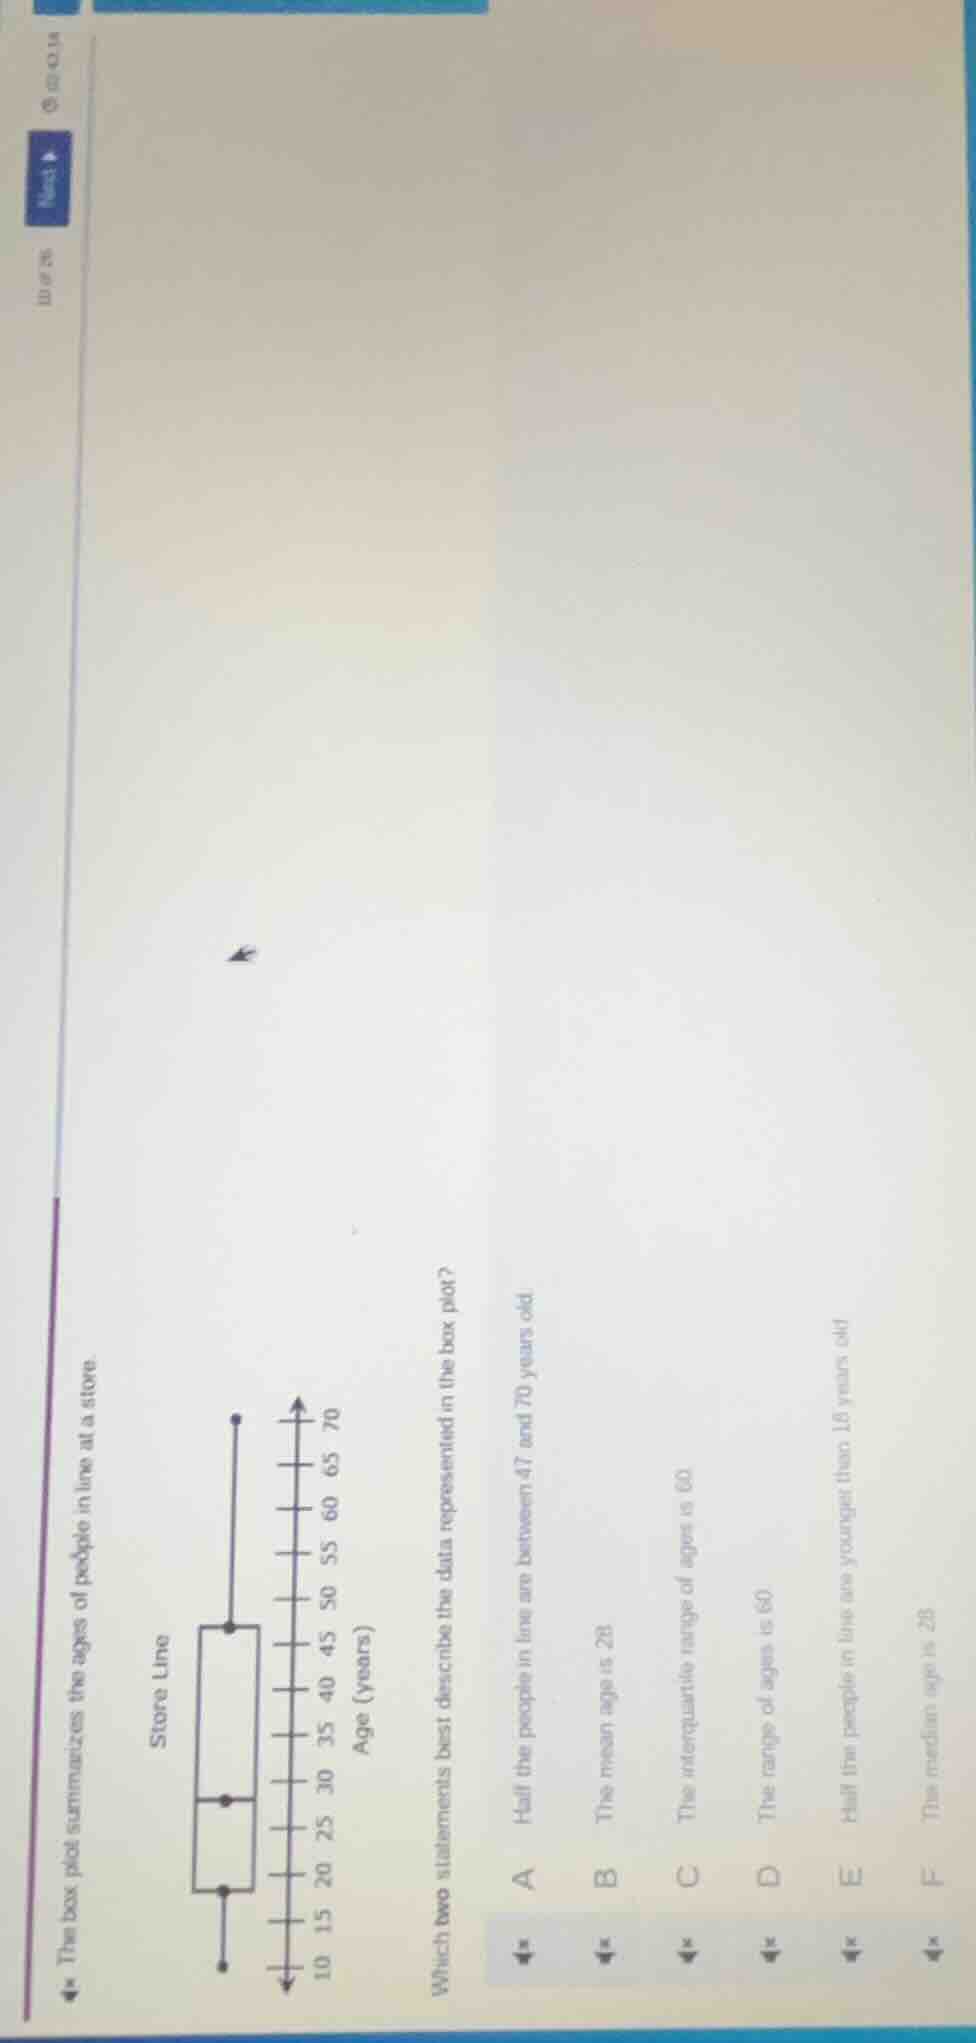
this box plot summarizes the ages of people in line at a store. which two statements best describe the data represented in the box plot? a half the people in line are between 47 and 70 years old b the mean age is 28 c the interquartile range of ages is 60 d the range of ages is 60 e half the people in line are younger than 15 years old f the median age is 28
Step1: Identify box plot values
Min = 10, Q1 = 18, Median (Q2) = 28, Q3 = 47, Max = 70
Step2: Check each statement
- A: 50% of data lies between Q1 and Q3 (18 and 47), not 47 and 70. Incorrect.
- B: Mean cannot be determined from box plot. Incorrect.
- C: Interquartile range = Q3 - Q1 = $47 - 18 = 29$. Incorrect.
- D: Range = Max - Min = $70 - 10 = 60$. Correct.
- E: 50% of data is below median (28), not 18. Incorrect.
- F: Median value is 28. Correct.

Snap & solve any problem in the app
Get step-by-step solutions on Sovi AI
Photo-based solutions with guided steps
Explore more problems and detailed explanations
D. The range of ages is 60
F. The median age is 28