QUESTION IMAGE
Question
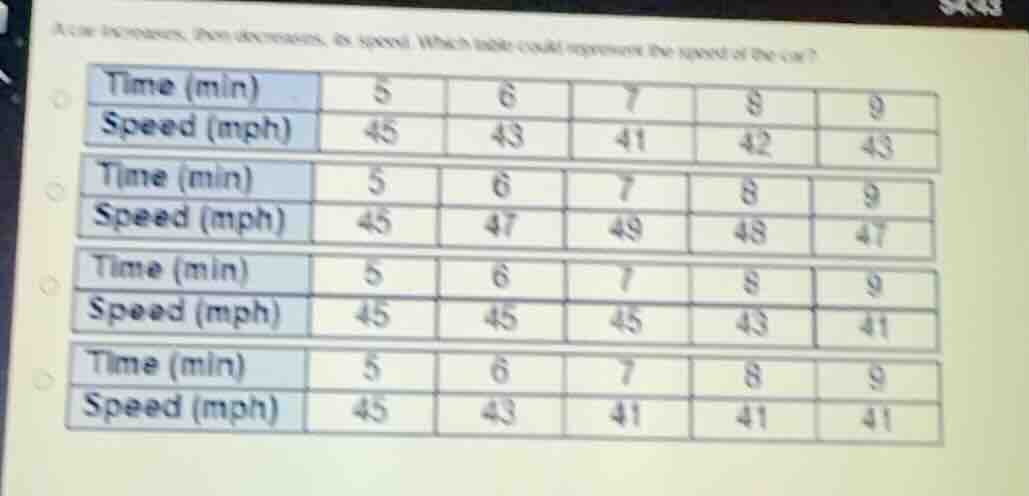
a car increases, then decreases, its speed. which table could represent the speed of the car?
time (min) 5 6 7 8 9
speed (mph) 45 43 41 42 43
time (min) 5 6 7 8 9
speed (mph) 45 47 49 48 47
time (min) 5 6 7 8 9
speed (mph) 45 45 45 43 41
time (min) 5 6 7 8 9
speed (mph) 45 43 41 41 41
Step1: Identify increasing phase
Check speed trend from 5-7 min:
- Table1: 45→43→41 (decreasing)
- Table2: 45→47→49 (increasing)
- Table3: 45→45→45 (constant)
- Table4: 45→43→41 (decreasing)
Step2: Identify decreasing phase
Check speed trend from 7-9 min:
- Table2: 49→48→47 (decreasing)
This matches "increase then decrease".

Snap & solve any problem in the app
Get step-by-step solutions on Sovi AI
Photo-based solutions with guided steps
Explore more problems and detailed explanations
B. Time (min): 5, 6, 7, 8, 9; Speed (mph): 45, 47, 49, 48, 47