QUESTION IMAGE
Question
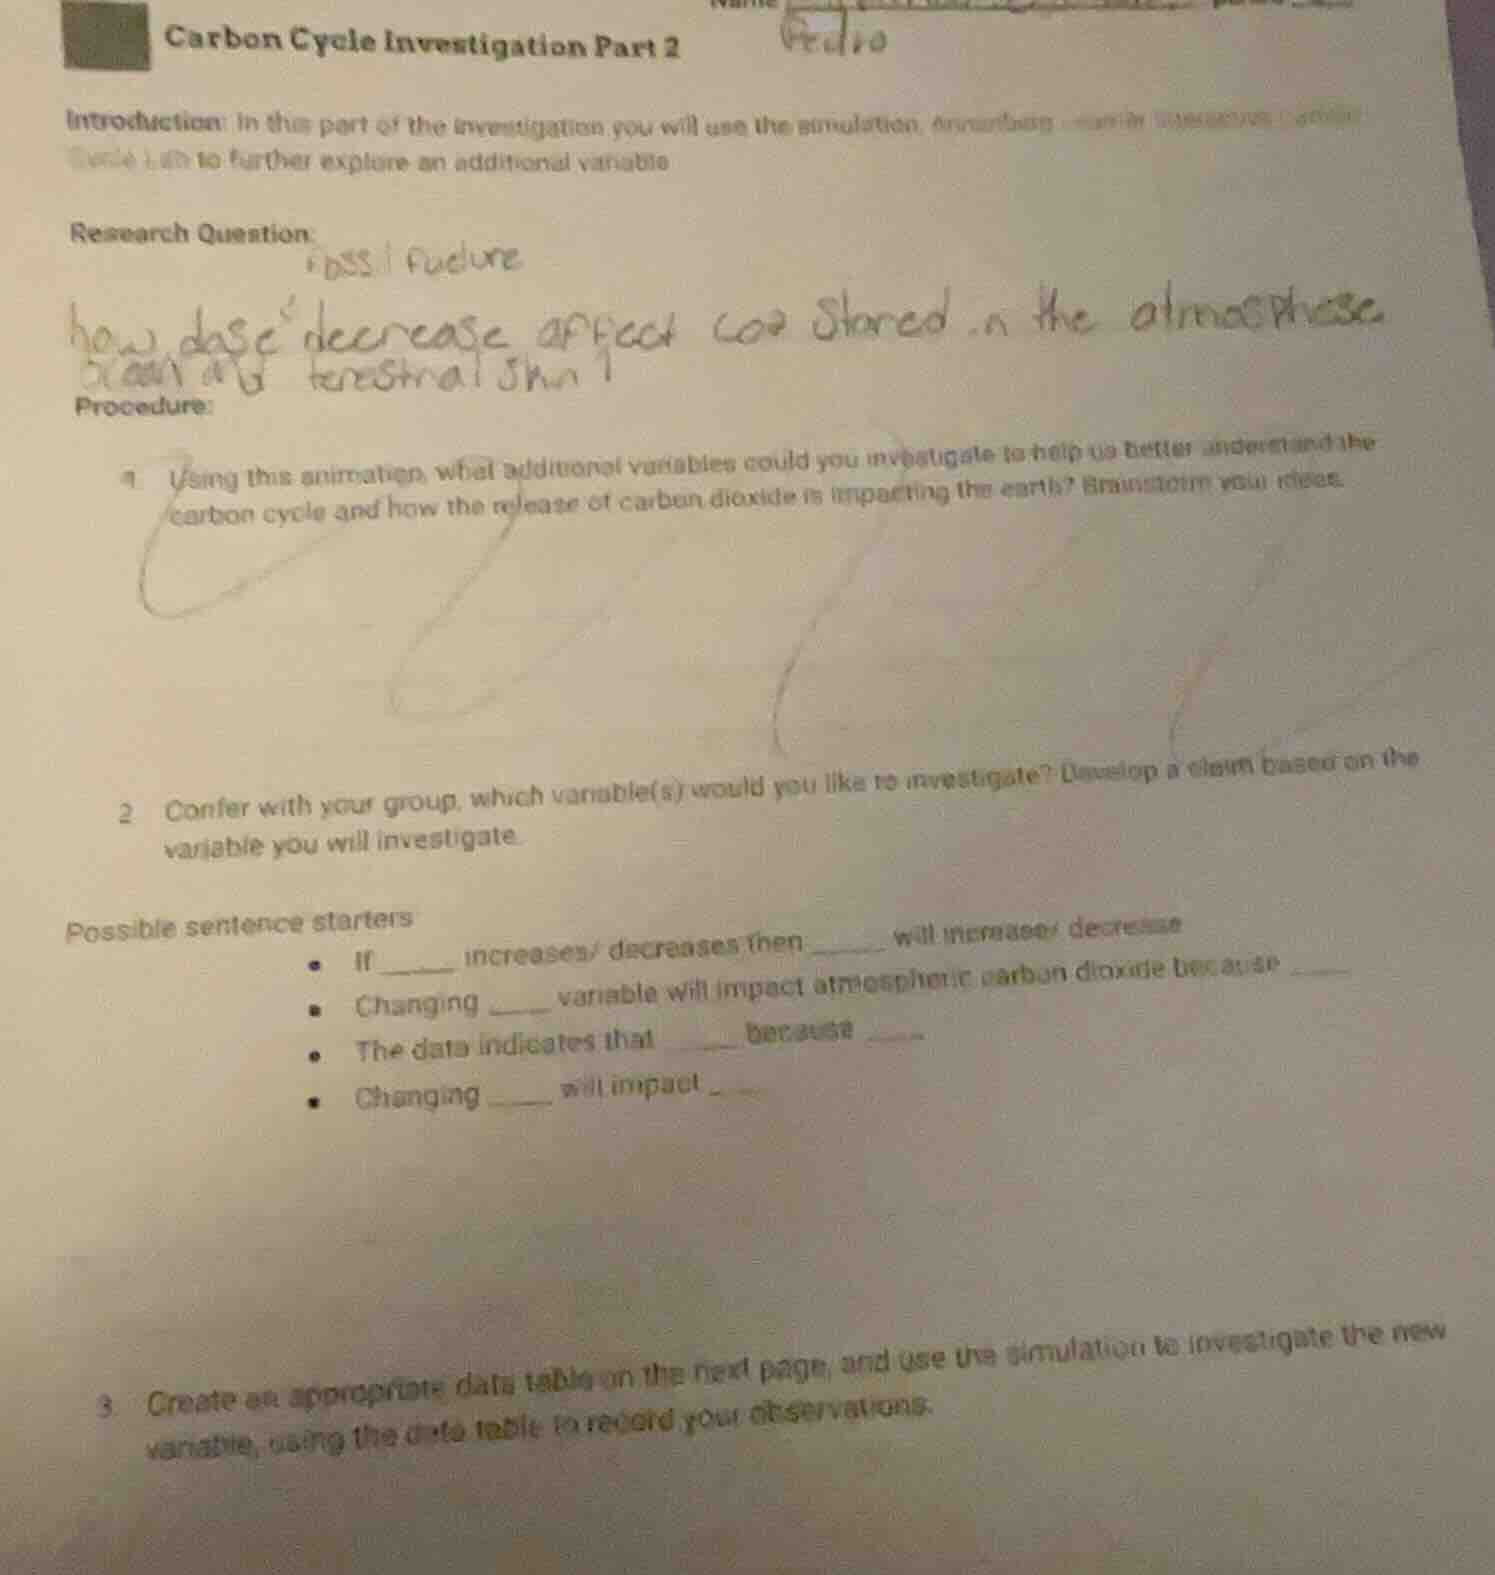
carbon cycle investigation part 2
name
pedro
introduction: in this part of the investigation, you will use the simulation to further explore an additional variable
research question:
fossil fuel use
how does decrease affect co₂ stored in the atmosphere
ocean and terrestrial?
procedure:
- using this animation, what additional variables could you investigate to help us better understand the carbon cycle and how the release of carbon dioxide is impacting the earth? brainstorm your ideas.
- confer with your group, which variable(s) would you like to investigate? develop a claim based on the variable you will investigate.
possible sentence starters
- if ____ increases/ decreases, then ____ will increase/ decrease
- changing ____ variable will impact atmospheric carbon dioxide because ____
- the data indicates that ____ because ____
- changing ____ will impact ____
- create an appropriate data table on the next page, and use the simulation to investigate the new variable, using the data table to record your observations.
Brief Explanations
- For brainstorming variables, focus on factors that alter carbon sources (release CO₂) or sinks (store CO₂).
- For the claim, use the provided sentence starters to link a variable to atmospheric CO₂, based on carbon cycle logic.
- The data table should track the chosen variable and corresponding atmospheric CO₂ levels.

Snap & solve any problem in the app
Get step-by-step solutions on Sovi AI
Photo-based solutions with guided steps
Explore more problems and detailed explanations
- Brainstormed Variables (Examples):
- Deforestation rate (loss of terrestrial sink)
- Fossil fuel combustion amount (human-caused source)
- Ocean temperature (affects ocean CO₂ absorption)
- Wildfire frequency (natural CO₂ source)
- Agricultural land conversion (loss of plant sinks)
- Sample Claim (using the handwritten research question):
If terrestrial plant cover decreases, then atmospheric CO₂ will increase, because terrestrial plants absorb CO₂ for photosynthesis, so fewer plants mean less CO₂ is removed from the atmosphere.
- Sample Data Table Structure:
| Trial Number | Terrestrial Plant Cover (Relative Amount) | Atmospheric CO₂ Level (ppm) |
|---|---|---|
| 2 | 75% | |
| 3 | 50% | |
| 4 | 25% |