QUESTION IMAGE
Question
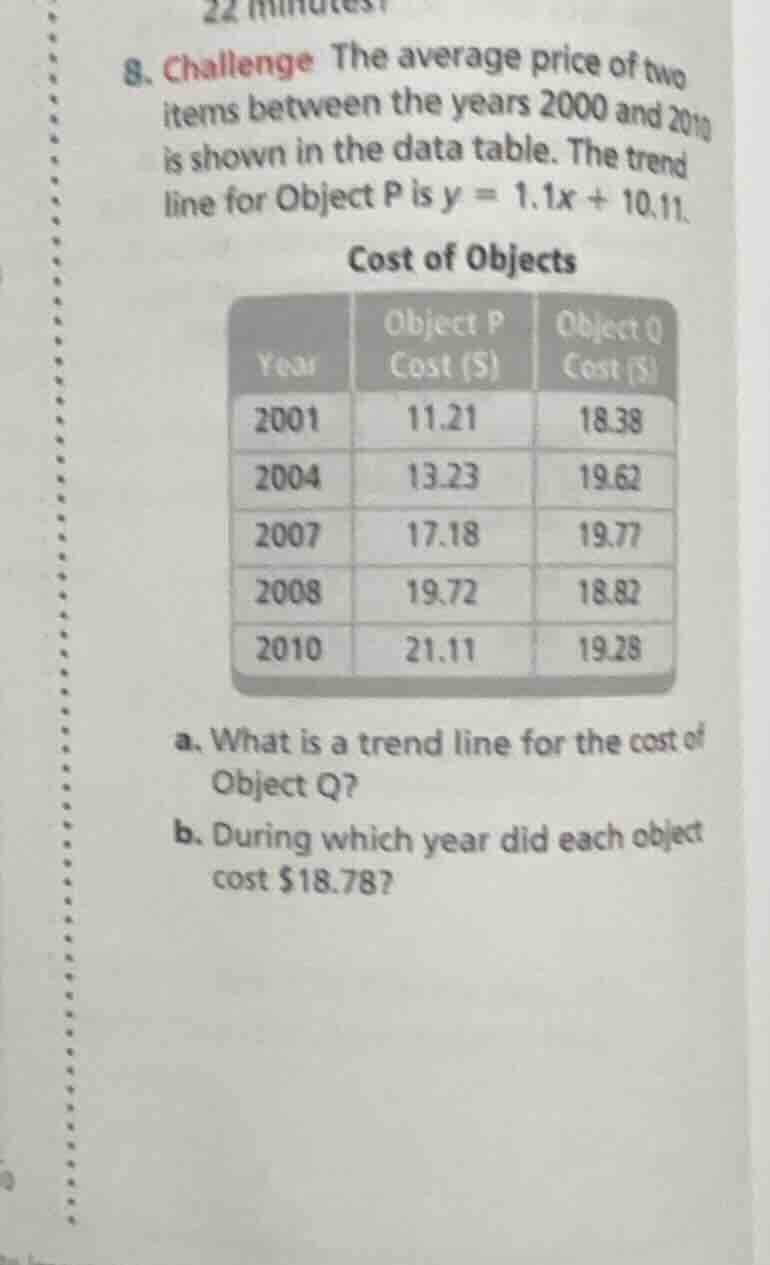
- challenge the average price of two items between the years 2000 and 2010 is shown in the data table. the trend line for object p is $y = 1.1x + 10.11$.
cost of objects
| year | object p cost ($) | object q cost ($) |
|---|---|---|
| 2004 | 13.23 | 19.62 |
| 2007 | 17.18 | 19.77 |
| 2008 | 19.72 | 18.82 |
| 2010 | 21.11 | 19.28 |
a. what is a trend line for the cost of object q?
b. during which year did each object cost $18.78?
Step1: Define x as year offset
Let $x = \text{Year} - 2000$, so 2001 is $x=1$, 2004 is $x=4$, 2007 is $x=7$, 2008 is $x=8$, 2010 is $x=10$.
Step2: Calculate trend line for Object Q
We use linear regression $y = mx + b$. First find $\bar{x}$, $\bar{y}$:
$\bar{x} = \frac{1+4+7+8+10}{5} = \frac{30}{5} = 6$
$\bar{y} = \frac{18.38+19.62+19.77+18.82+19.28}{5} = \frac{95.87}{5} = 19.174$
Calculate slope $m$:
$m = \frac{\sum_{i=1}^5 (x_i-\bar{x})(y_i-\bar{y})}{\sum_{i=1}^5 (x_i-\bar{x})^2}$
Numerator:
$(1-6)(18.38-19.174)+(4-6)(19.62-19.174)+(7-6)(19.77-19.174)+(8-6)(18.82-19.174)+(10-6)(19.28-19.174)$
$= (-5)(-0.794)+(-2)(0.446)+(1)(0.596)+(2)(-0.354)+(4)(0.106)$
$= 3.97 - 0.892 + 0.596 - 0.708 + 0.424 = 3.39$
Denominator:
$(1-6)^2+(4-6)^2+(7-6)^2+(8-6)^2+(10-6)^2 = 25+4+1+4+16 = 50$
$m = \frac{3.39}{50} = 0.0678$
Find intercept $b = \bar{y} - m\bar{x} = 19.174 - (0.0678)(6) = 19.174 - 0.4068 = 18.7672$
Trend line: $y = 0.068x + 18.77$ (rounded)
Step3: Solve for Object P's year
Set $1.1x + 10.11 = 18.78$
$1.1x = 18.78 - 10.11 = 8.67$
$x = \frac{8.67}{1.1} \approx 7.88$, so Year = $2000 + 7.88 \approx 2008$
Step4: Solve for Object Q's year
Set $0.068x + 18.77 = 18.78$
$0.068x = 0.01$
$x = \frac{0.01}{0.068} \approx 0.15$, so Year = $2000 + 0.15 \approx 2000$ (or use precise $b=18.7672$: $0.0678x = 18.78-18.7672=0.0128$, $x\approx0.19$, still ~2000)

Snap & solve any problem in the app
Get step-by-step solutions on Sovi AI
Photo-based solutions with guided steps
Explore more problems and detailed explanations
a. $y = 0.07x + 18.77$ (or more precise $y=0.068x+18.77$)
b. Object P: ~2008; Object Q: ~2000