QUESTION IMAGE
Question
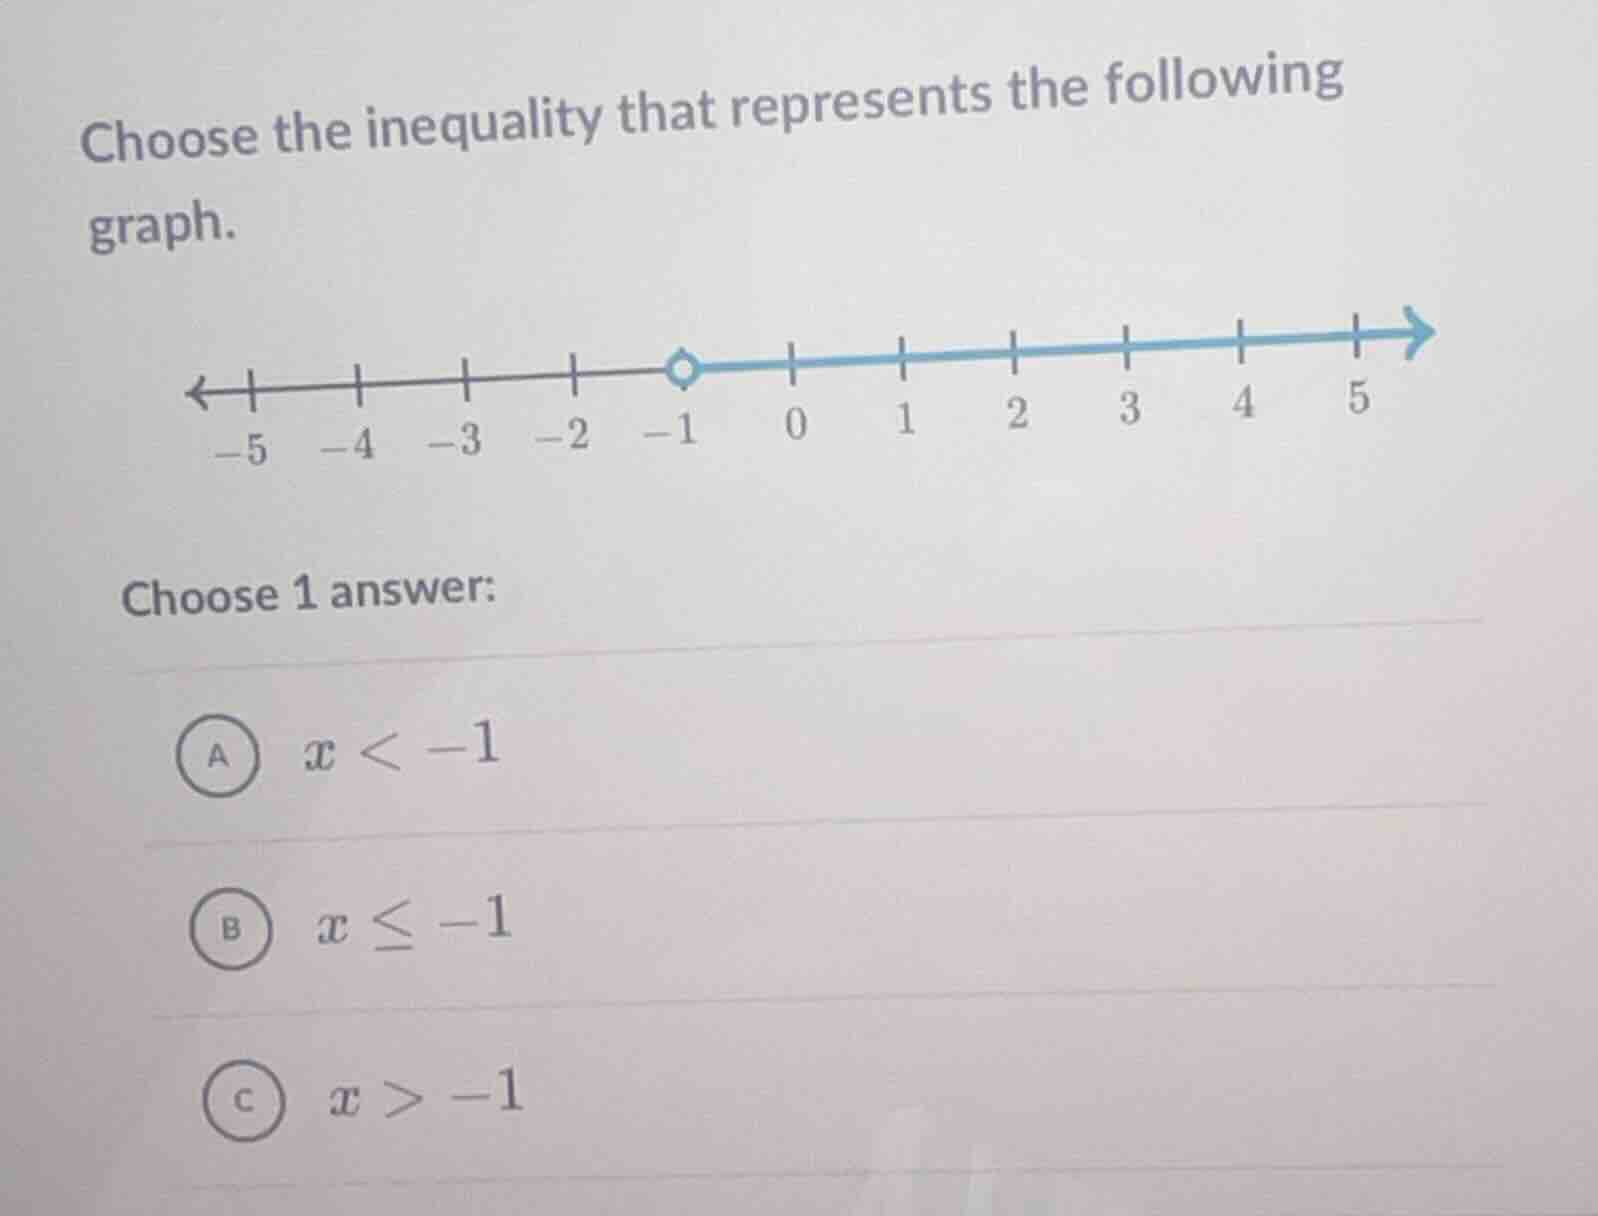
choose the inequality that represents the following graph.
number line from -5 to 5 with an open circle at -1 and blue line to the right
choose 1 answer:
a ( x < -1 )
b ( x leq -1 )
c ( x > -1 )
Step1: Analyze the graph's endpoint
The graph has an open circle at \( x = -1 \), which means \( -1 \) is not included in the solution set.
Step2: Analyze the direction of the line
The line is shaded to the right of \( -1 \), indicating values greater than \( -1 \).
Step3: Match with the inequalities
- Option A: \( x < -1 \) (shaded left, incorrect).
- Option B: \( x \leq -1 \) (closed circle and shaded left, incorrect).
- Option C: \( x > -1 \) (open circle and shaded right, correct).

Snap & solve any problem in the app
Get step-by-step solutions on Sovi AI
Photo-based solutions with guided steps
Explore more problems and detailed explanations
C. \( x > -1 \)