QUESTION IMAGE
Question
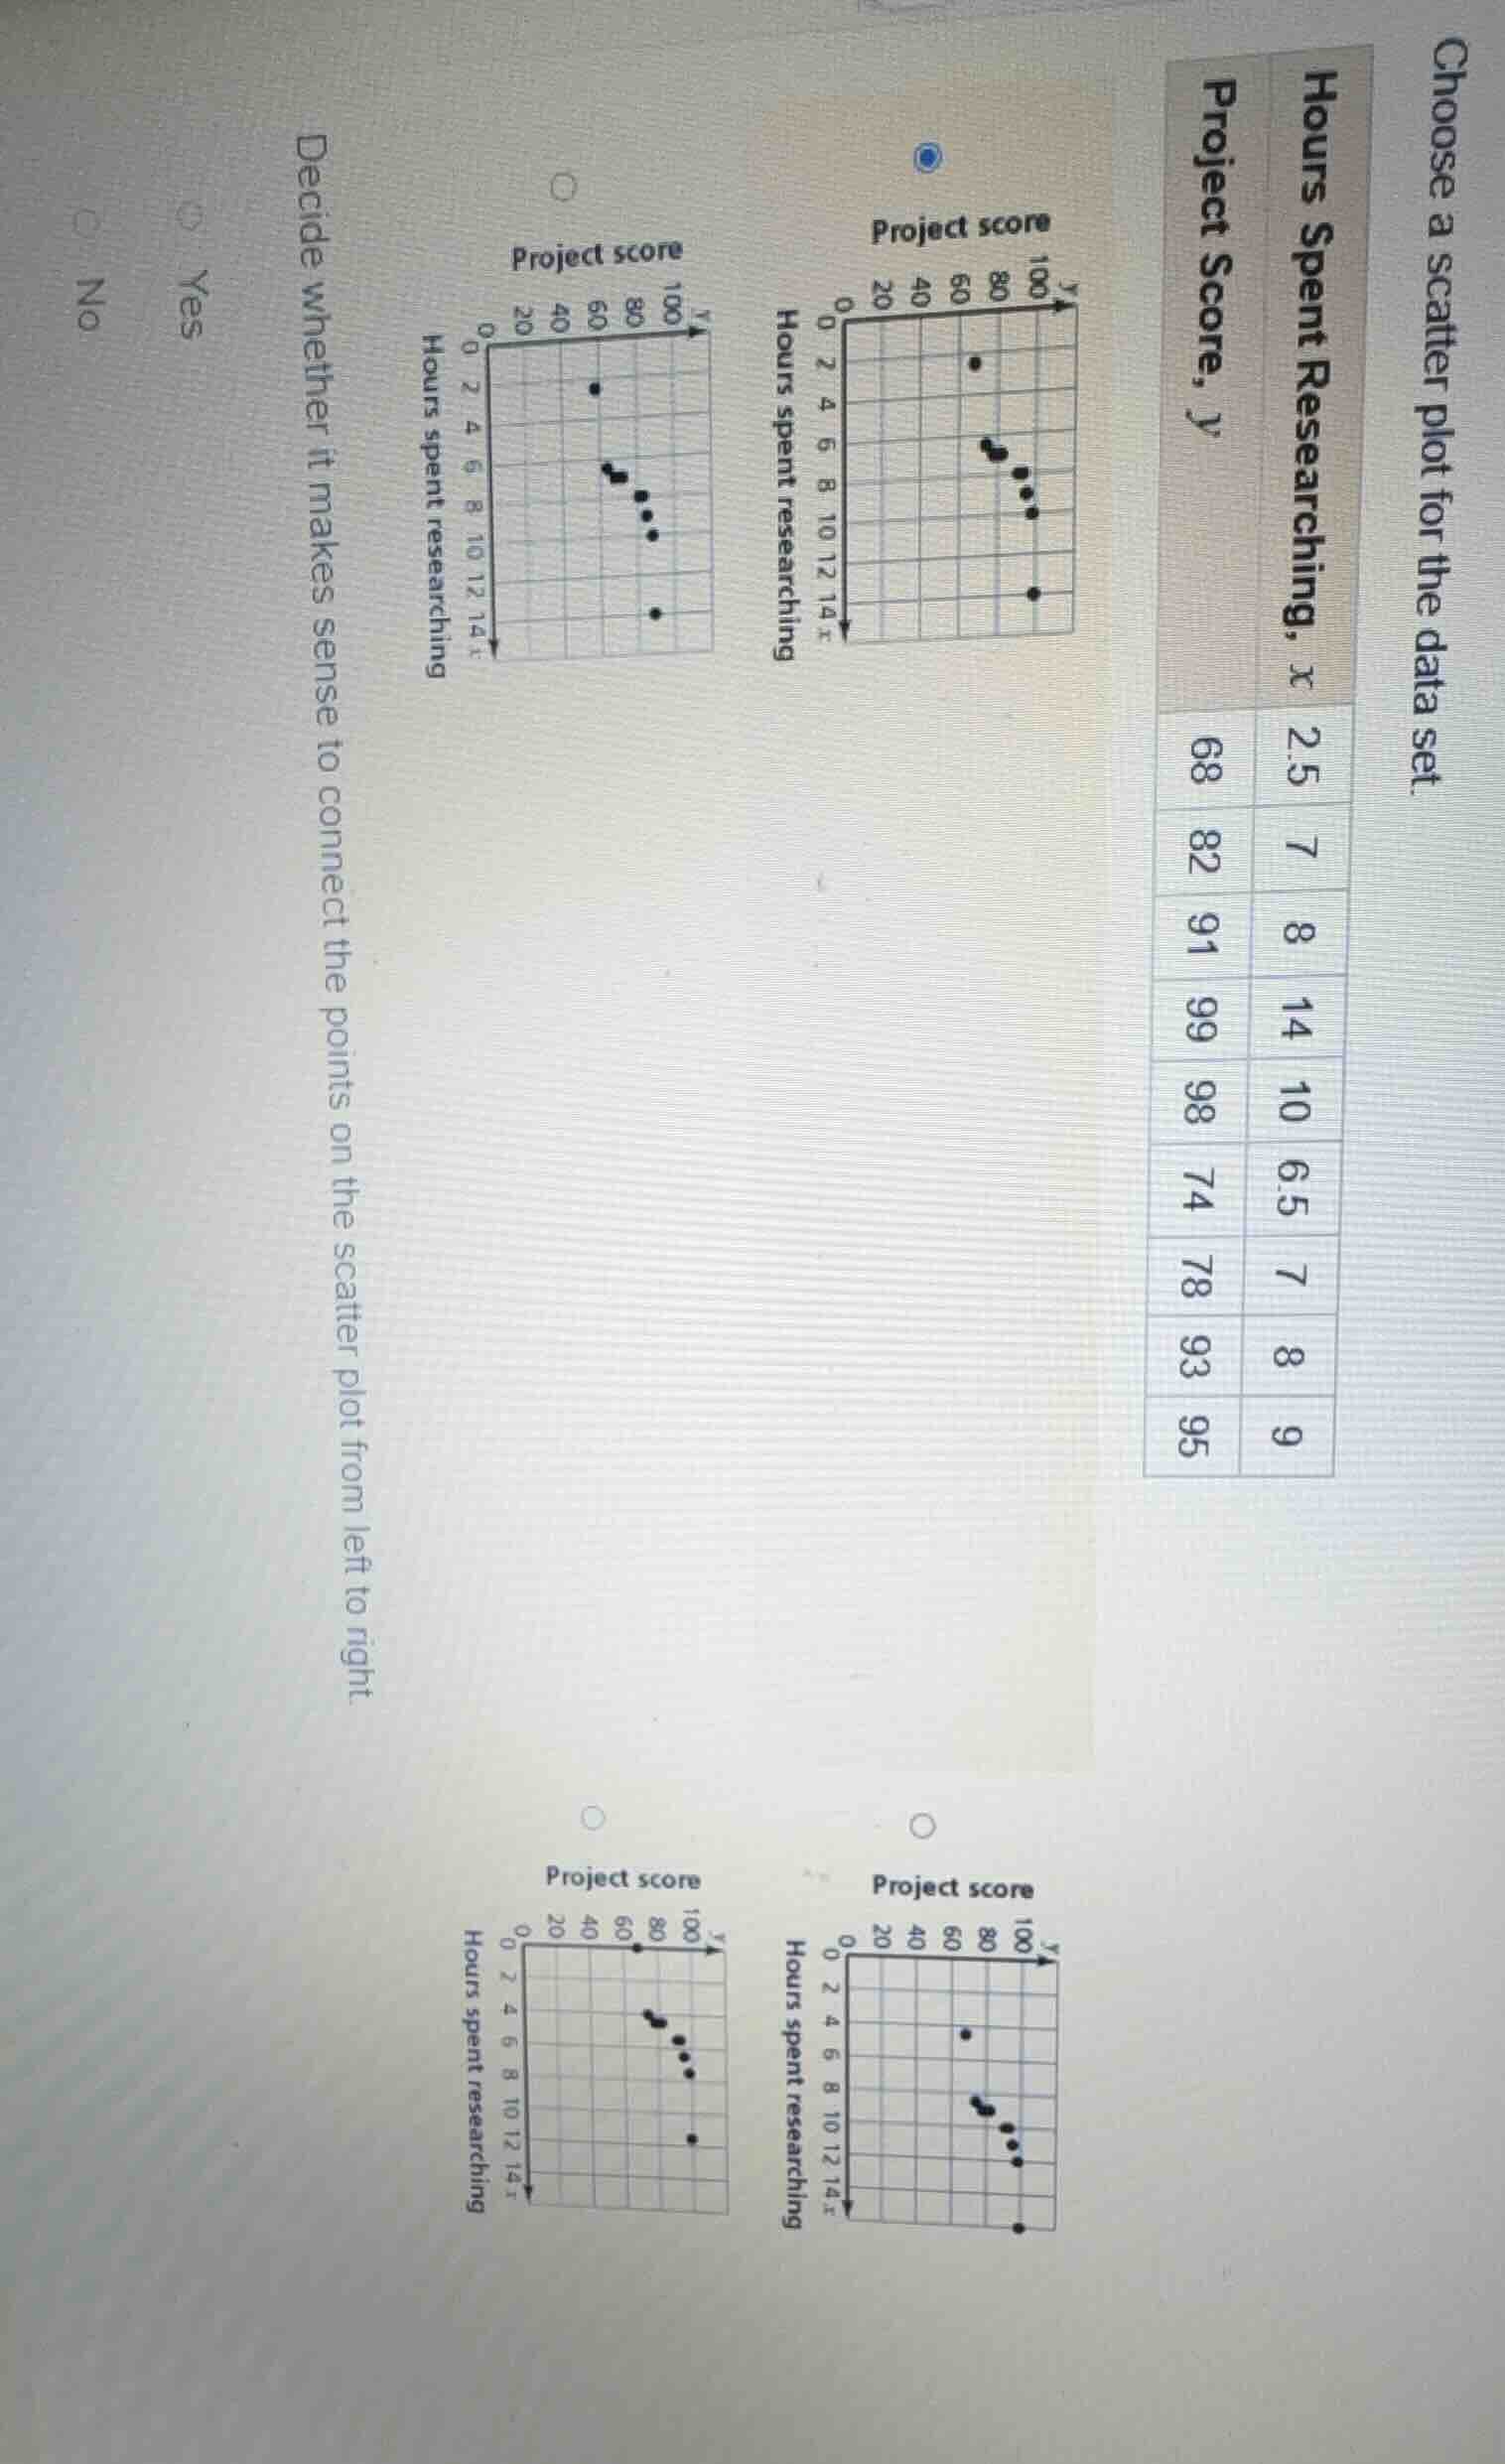
choose a scatter plot for the data set.
hours spent researching, ( x ) | project score, ( y )
2.5 | 68
7 | 82
8 | 91
14 | 99
10 | 98
6.5 | 74
7 | 78
8 | 93
9 | 95
decide whether it makes sense to connect the points on the scatter plot from left to right.
yes
no
Step1: List all data points
$(2.5, 68), (7, 82), (8, 91), (14, 99), (10, 98), (6.5, 74), (7, 78), (8, 93), (9, 95)$
Step2: Match points to scatter plots
Compare each point to the four plots:
- The top-left plot has a point at $x=14$ with low $y$, which does not match $(14,99)$.
- The top-right plot has $(2.5,68)$, $(7,82)$, $(7,78)$, $(8,91)$, $(8,93)$, $(9,95)$, $(10,98)$, $(14,99)$, $(6.5,74)$ all correctly plotted.
- The bottom-left plot has a point at $x=0$ with high $y$, which is not in the data.
- The bottom-right plot has a point at $x=14$ with low $y$, which does not match $(14,99)$.
Step3: Evaluate connecting scatter plot points
Scatter plots show relationships between independent $(x)$ and dependent $(y)$ variables, not a continuous sequence. Connecting points implies a continuous function, which is not appropriate here.

Snap & solve any problem in the app
Get step-by-step solutions on Sovi AI
Photo-based solutions with guided steps
Explore more problems and detailed explanations
- Correct scatter plot: The top-right scatter plot (marked with the blue circle)
- Decision about connecting points: No