QUESTION IMAGE
Question
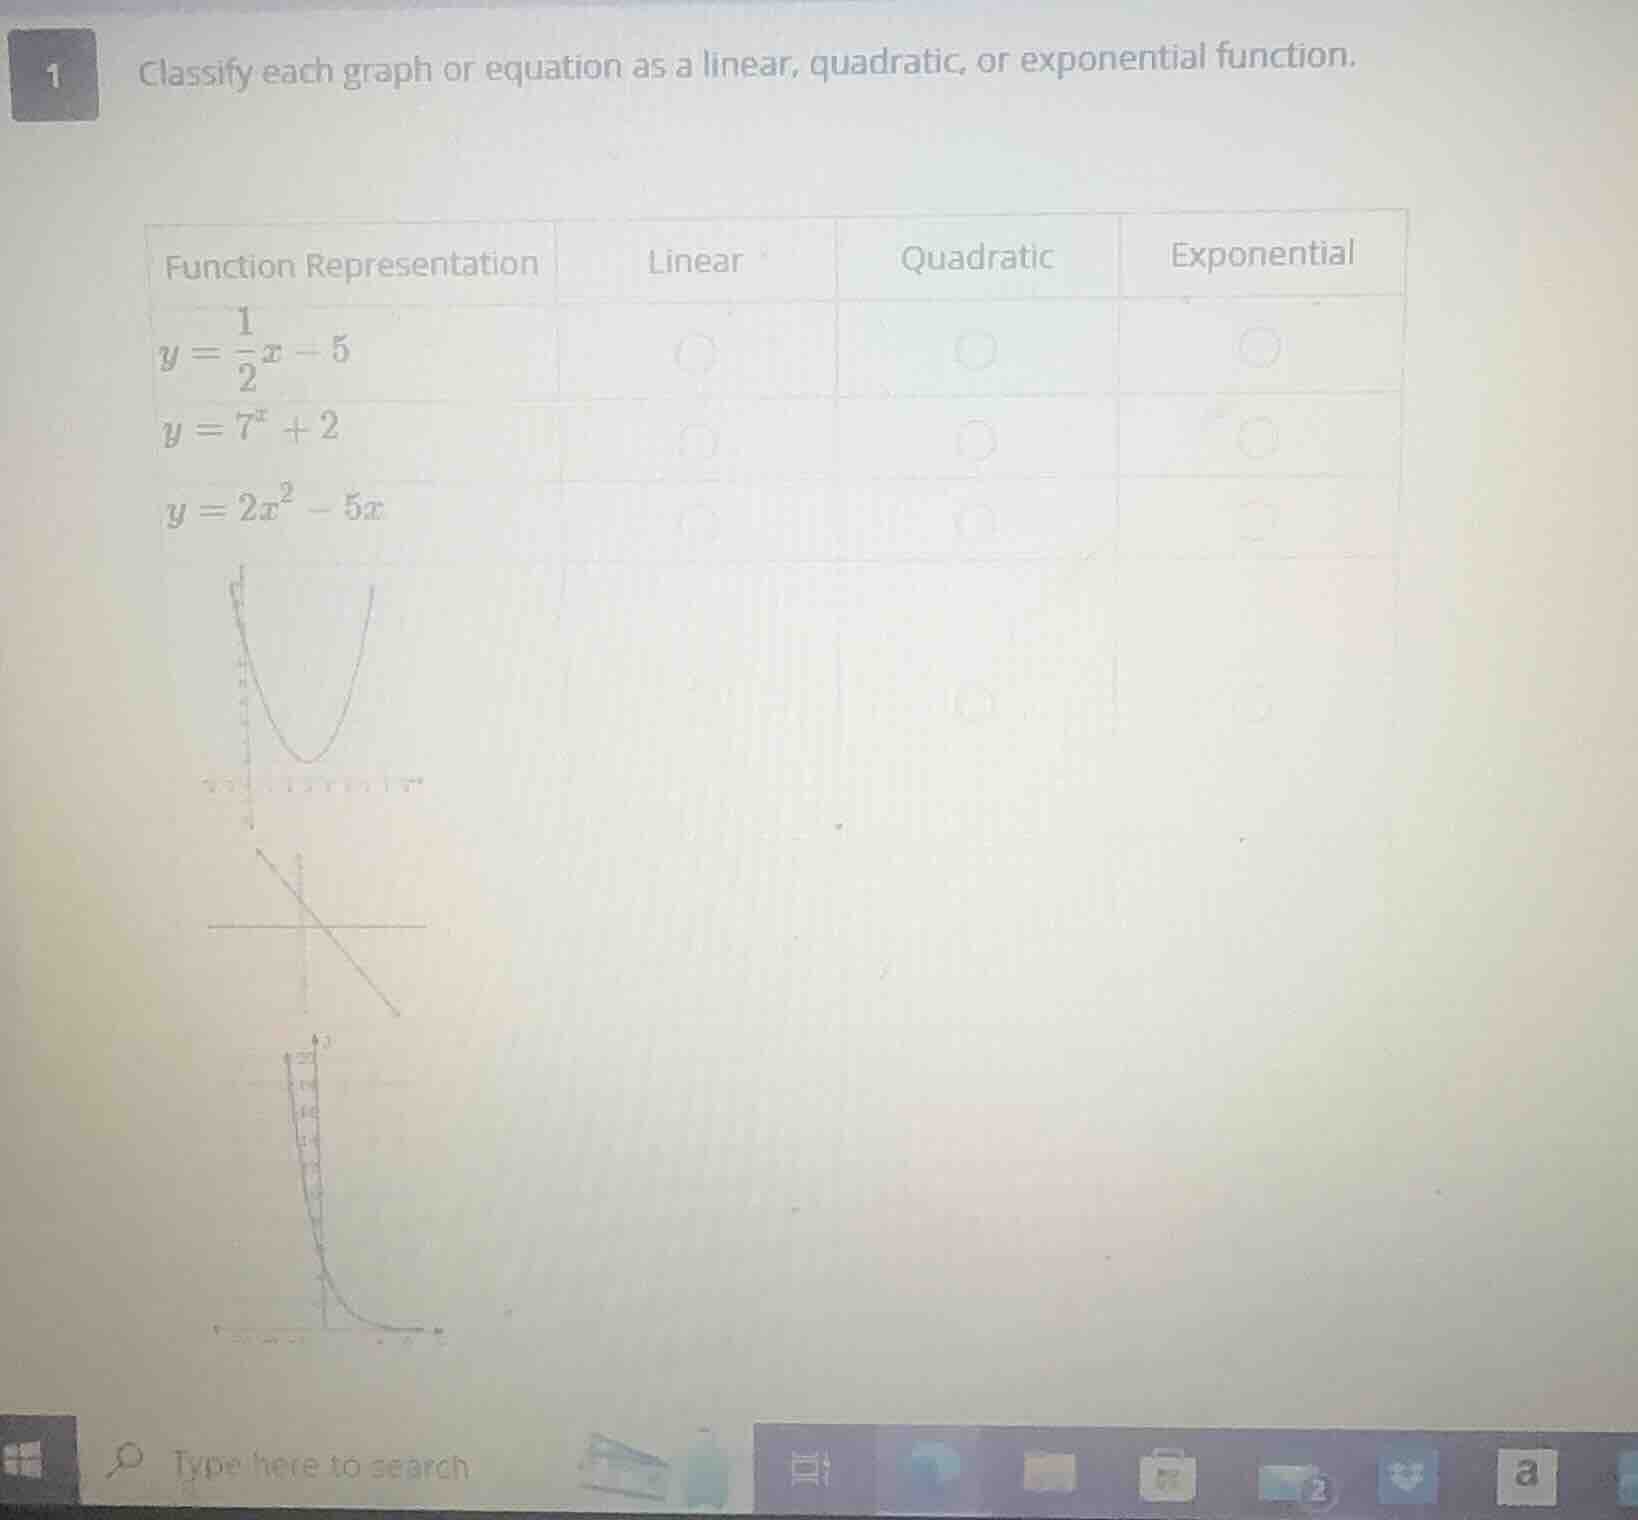
1 classify each graph or equation as a linear, quadratic, or exponential function.
function representation linear quadratic exponential
$y = \frac{1}{2}x - 5$
$y = 7^x + 2$
$y = 2x^2 - 5x$
graphs: a parabola opening upwards, a straight line with negative slope, a curve decreasing towards the x - axis as x increases
For \( y = \frac{1}{2}x - 5 \):
Step1: Recall linear function form
A linear function has the form \( y = mx + b \), where \( m \) is the slope and \( b \) is the y - intercept.
The equation \( y=\frac{1}{2}x - 5 \) is in the form \( y=mx + b \) with \( m=\frac{1}{2} \) and \( b=- 5 \). So it is a linear function.
For \( y = 7^{x}+2 \):
Step1: Recall exponential function form
An exponential function has the form \( y = a^{x}+k \) (where \( a>0,a
eq1 \)).
The equation \( y = 7^{x}+2 \) is in the form of an exponential function with \( a = 7 \) and \( k = 2 \). So it is an exponential function.
For \( y=2x^{2}-5x \):
Step1: Recall quadratic function form
A quadratic function has the form \( y=ax^{2}+bx + c\) (where \( a
eq0 \)).
The equation \( y = 2x^{2}-5x \) is in the form \( y=ax^{2}+bx + c\) with \( a = 2\), \( b=-5 \) and \( c = 0 \). So it is a quadratic function.
For the parabola - shaped graph:
Step1: Recall quadratic graph shape
The graph of a quadratic function is a parabola (a U - shaped or inverted U - shaped curve). The given graph that looks like a parabola is the graph of a quadratic function.
For the straight - line graph:
Step1: Recall linear graph shape
The graph of a linear function is a straight line. The given graph that is a straight line is the graph of a linear function.
For the graph with exponential growth/decay shape:
Step1: Recall exponential graph shape
The graph of an exponential function has a characteristic curve that either grows rapidly (for \( a>1 \)) or decays rapidly (for \( 0 < a<1 \)) as \( x \) changes. The given graph with the curve that shows exponential behavior is the graph of an exponential function.
Classification Table:
| Function Representation | Linear | Quadratic | Exponential |
|---|---|---|---|
| \( y = 7^{x}+2 \) | $\boldsymbol{\circ}$ | ||
| \( y=2x^{2}-5x \) | $\boldsymbol{\circ}$ | ||
| Parabola - shaped graph | $\boldsymbol{\circ}$ | ||
| Straight - line graph | $\boldsymbol{\circ}$ | ||
| Exponential - curve graph | $\boldsymbol{\circ}$ |

Snap & solve any problem in the app
Get step-by-step solutions on Sovi AI
Photo-based solutions with guided steps
Explore more problems and detailed explanations
For \( y = \frac{1}{2}x - 5 \):
Step1: Recall linear function form
A linear function has the form \( y = mx + b \), where \( m \) is the slope and \( b \) is the y - intercept.
The equation \( y=\frac{1}{2}x - 5 \) is in the form \( y=mx + b \) with \( m=\frac{1}{2} \) and \( b=- 5 \). So it is a linear function.
For \( y = 7^{x}+2 \):
Step1: Recall exponential function form
An exponential function has the form \( y = a^{x}+k \) (where \( a>0,a
eq1 \)).
The equation \( y = 7^{x}+2 \) is in the form of an exponential function with \( a = 7 \) and \( k = 2 \). So it is an exponential function.
For \( y=2x^{2}-5x \):
Step1: Recall quadratic function form
A quadratic function has the form \( y=ax^{2}+bx + c\) (where \( a
eq0 \)).
The equation \( y = 2x^{2}-5x \) is in the form \( y=ax^{2}+bx + c\) with \( a = 2\), \( b=-5 \) and \( c = 0 \). So it is a quadratic function.
For the parabola - shaped graph:
Step1: Recall quadratic graph shape
The graph of a quadratic function is a parabola (a U - shaped or inverted U - shaped curve). The given graph that looks like a parabola is the graph of a quadratic function.
For the straight - line graph:
Step1: Recall linear graph shape
The graph of a linear function is a straight line. The given graph that is a straight line is the graph of a linear function.
For the graph with exponential growth/decay shape:
Step1: Recall exponential graph shape
The graph of an exponential function has a characteristic curve that either grows rapidly (for \( a>1 \)) or decays rapidly (for \( 0 < a<1 \)) as \( x \) changes. The given graph with the curve that shows exponential behavior is the graph of an exponential function.
Classification Table:
| Function Representation | Linear | Quadratic | Exponential |
|---|---|---|---|
| \( y = 7^{x}+2 \) | $\boldsymbol{\circ}$ | ||
| \( y=2x^{2}-5x \) | $\boldsymbol{\circ}$ | ||
| Parabola - shaped graph | $\boldsymbol{\circ}$ | ||
| Straight - line graph | $\boldsymbol{\circ}$ | ||
| Exponential - curve graph | $\boldsymbol{\circ}$ |