QUESTION IMAGE
Question
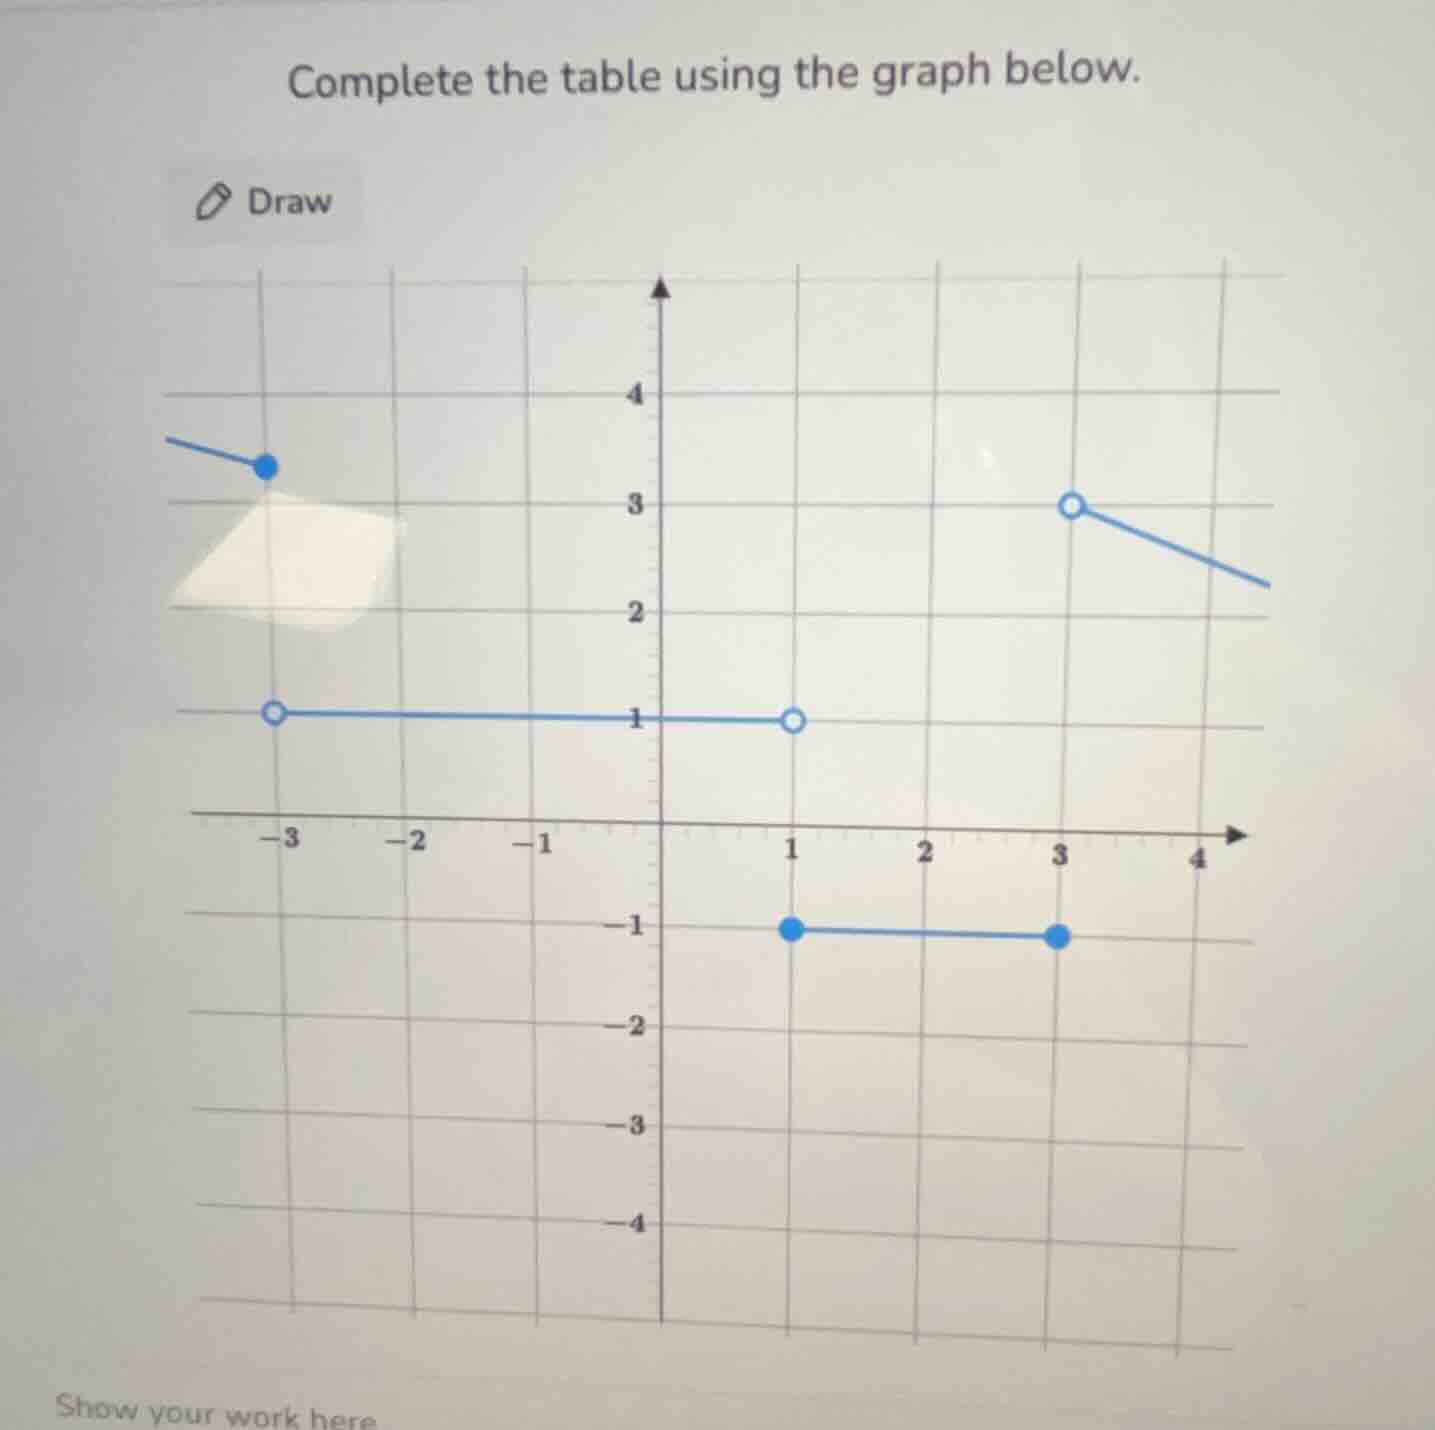
complete the table using the graph below. draw (graph of a piecewise function on a coordinate plane with grid lines, showing different segments with open and closed circles at various x - values like - 3, 1, 3 etc. and y - values like 1, - 1, 3 etc.) show your work here
Since the table to be completed is not shown, we can analyze the graph to find the function's values at different \( x \)-values. Let's assume the table has columns for \( x \) and \( f(x) \), and we'll find values for key \( x \)-points (like \( x = -3, x = 1, x = 3 \), etc.) by examining the graph:
Step 1: Analyze \( x = -3 \)
- At \( x = -3 \), there are two points: a closed dot (filled circle) at \( y = 3.5 \) (or \( \frac{7}{2} \)) and an open dot (hollow circle) at \( y = 1 \).
- Closed dots mean the function includes that point, open dots mean it doesn’t. So \( f(-3) = 3.5 \) (or \( \frac{7}{2} \)).
Step 2: Analyze \( x \) between \( -3 \) and \( 1 \) (excluding endpoints)
- The horizontal line with open dots at \( x = -3 \) (open) and \( x = 1 \) (open) has \( y = 1 \). For \( -3 < x < 1 \), the function follows this line, so \( f(x) = 1 \) here.
Step 3: Analyze \( x = 1 \)
- At \( x = 1 \), there’s an open dot at \( y = 1 \) and a closed dot at \( y = -1 \). So \( f(1) = -1 \) (closed dot is included).
Step 4: Analyze \( x \) between \( 1 \) and \( 3 \) (excluding endpoints)
- The horizontal line with closed dots at \( x = 1 \) and \( x = 3 \) has \( y = -1 \). So for \( 1 < x < 3 \), \( f(x) = -1 \).
Step 5: Analyze \( x = 3 \)
- At \( x = 3 \), there’s an open dot at \( y = 3 \) and a closed dot at \( y = -1 \). So \( f(3) = -1 \) (closed dot is included), and the line with the open dot at \( x = 3 \) starts at \( y = 3 \) for \( x > 3 \).
Step 6: Analyze \( x > 3 \)
- For \( x > 3 \), the line with the open dot at \( x = 3 \) ( \( y = 3 \)) has a slope. But since we need to complete the table, we focus on key \( x \)-values. For \( x = 3 \), \( f(3) = -1 \) (from the horizontal line), and for \( x > 3 \), \( f(x) \) follows the line with \( y = 3 \) at \( x = 3 \) (open dot) and decreases.
If the table includes \( x = -3, 1, 3 \), the values would be:
| \( x \) | \( f(x) \) |
|---|---|
| \( 0 \) (between \( -3 \) and \( 1 \)) | \( 1 \) |
| \( 1 \) | \( -1 \) |
| \( 2 \) (between \( 1 \) and \( 3 \)) | \( -1 \) |
| \( 3 \) | \( -1 \) |
| \( 4 \) (greater than \( 3 \)) | \( 2.5 \) (or \( \frac{5}{2} \)) (from the decreasing line) |
To fully complete the table, we need the exact columns/rows of the table. If you provide the table’s structure (e.g., \( x \)-values to evaluate), we can refine the answer.
For example, if the table asks for \( f(-3) \), \( f(0) \), \( f(1) \), \( f(2) \), \( f(3) \):
| \( x \) | \( f(x) \) |
|---|---|
| \( 0 \) | \( 1 \) |
| \( 1 \) | \( -1 \) |
| \( 2 \) | \( -1 \) |
| \( 3 \) | \( -1 \) |
(Note: The exact \( y \)-values depend on the grid’s precision; adjust if the graph’s grid has different intervals.)

Snap & solve any problem in the app
Get step-by-step solutions on Sovi AI
Photo-based solutions with guided steps
Explore more problems and detailed explanations
Since the table to be completed is not shown, we can analyze the graph to find the function's values at different \( x \)-values. Let's assume the table has columns for \( x \) and \( f(x) \), and we'll find values for key \( x \)-points (like \( x = -3, x = 1, x = 3 \), etc.) by examining the graph:
Step 1: Analyze \( x = -3 \)
- At \( x = -3 \), there are two points: a closed dot (filled circle) at \( y = 3.5 \) (or \( \frac{7}{2} \)) and an open dot (hollow circle) at \( y = 1 \).
- Closed dots mean the function includes that point, open dots mean it doesn’t. So \( f(-3) = 3.5 \) (or \( \frac{7}{2} \)).
Step 2: Analyze \( x \) between \( -3 \) and \( 1 \) (excluding endpoints)
- The horizontal line with open dots at \( x = -3 \) (open) and \( x = 1 \) (open) has \( y = 1 \). For \( -3 < x < 1 \), the function follows this line, so \( f(x) = 1 \) here.
Step 3: Analyze \( x = 1 \)
- At \( x = 1 \), there’s an open dot at \( y = 1 \) and a closed dot at \( y = -1 \). So \( f(1) = -1 \) (closed dot is included).
Step 4: Analyze \( x \) between \( 1 \) and \( 3 \) (excluding endpoints)
- The horizontal line with closed dots at \( x = 1 \) and \( x = 3 \) has \( y = -1 \). So for \( 1 < x < 3 \), \( f(x) = -1 \).
Step 5: Analyze \( x = 3 \)
- At \( x = 3 \), there’s an open dot at \( y = 3 \) and a closed dot at \( y = -1 \). So \( f(3) = -1 \) (closed dot is included), and the line with the open dot at \( x = 3 \) starts at \( y = 3 \) for \( x > 3 \).
Step 6: Analyze \( x > 3 \)
- For \( x > 3 \), the line with the open dot at \( x = 3 \) ( \( y = 3 \)) has a slope. But since we need to complete the table, we focus on key \( x \)-values. For \( x = 3 \), \( f(3) = -1 \) (from the horizontal line), and for \( x > 3 \), \( f(x) \) follows the line with \( y = 3 \) at \( x = 3 \) (open dot) and decreases.
If the table includes \( x = -3, 1, 3 \), the values would be:
| \( x \) | \( f(x) \) |
|---|---|
| \( 0 \) (between \( -3 \) and \( 1 \)) | \( 1 \) |
| \( 1 \) | \( -1 \) |
| \( 2 \) (between \( 1 \) and \( 3 \)) | \( -1 \) |
| \( 3 \) | \( -1 \) |
| \( 4 \) (greater than \( 3 \)) | \( 2.5 \) (or \( \frac{5}{2} \)) (from the decreasing line) |
To fully complete the table, we need the exact columns/rows of the table. If you provide the table’s structure (e.g., \( x \)-values to evaluate), we can refine the answer.
For example, if the table asks for \( f(-3) \), \( f(0) \), \( f(1) \), \( f(2) \), \( f(3) \):
| \( x \) | \( f(x) \) |
|---|---|
| \( 0 \) | \( 1 \) |
| \( 1 \) | \( -1 \) |
| \( 2 \) | \( -1 \) |
| \( 3 \) | \( -1 \) |
(Note: The exact \( y \)-values depend on the grid’s precision; adjust if the graph’s grid has different intervals.)