QUESTION IMAGE
Question
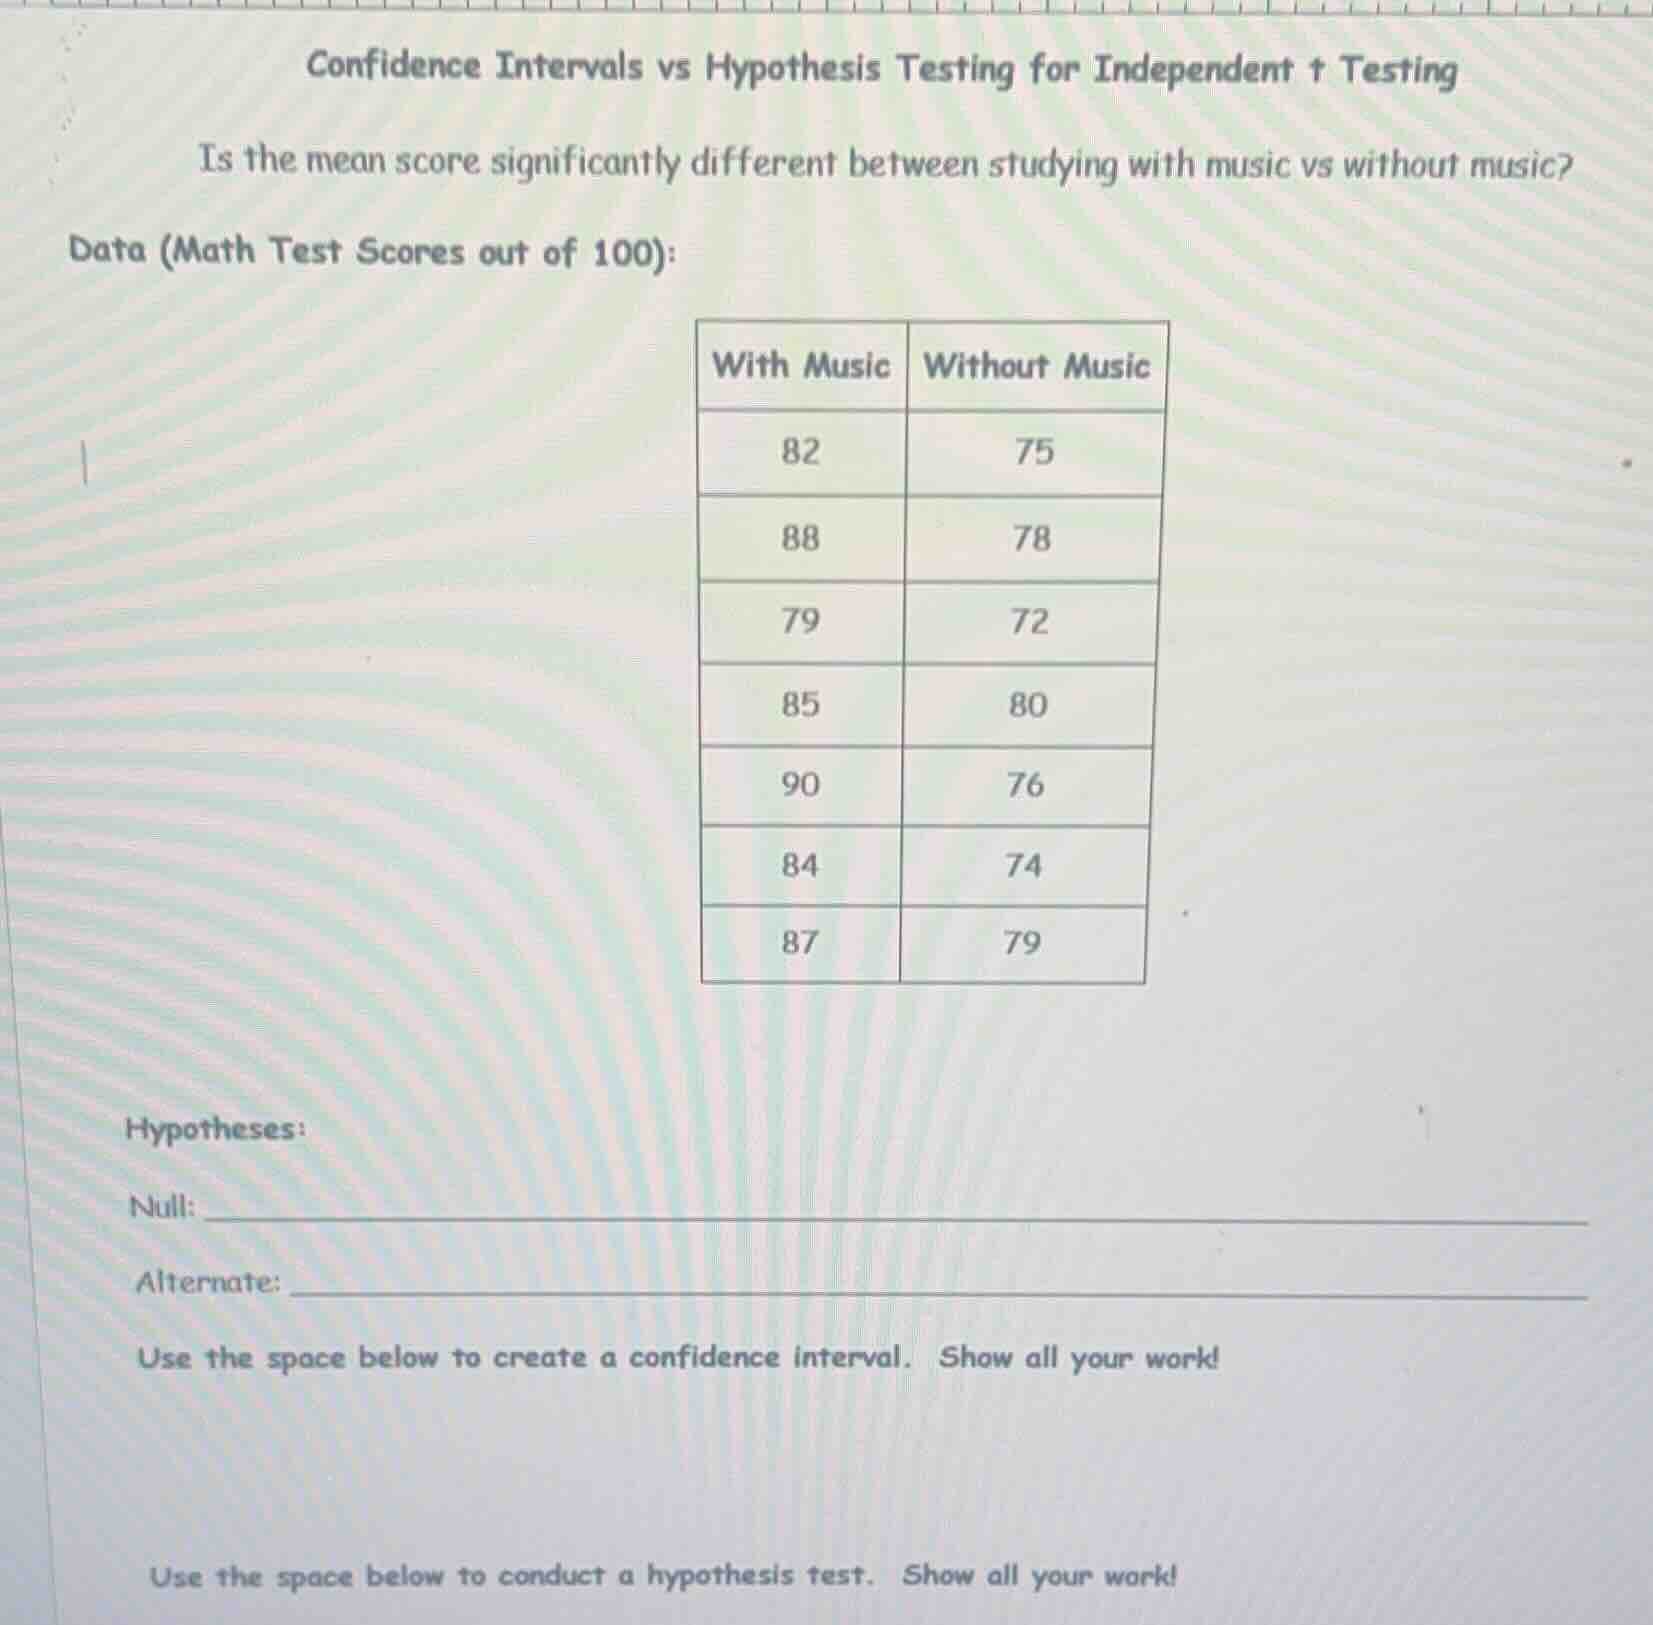
confidence intervals vs hypothesis testing for independent t testing
is the mean score significantly different between studying with music vs without music?
data (math test scores out of 100):
with music without music
82 75
88 78
79 72
85 80
90 76
84 74
87 79
hypotheses:
null: ____________
alternate: ____________
use the space below to create a confidence interval. show all your work!
use the space below to conduct a hypothesis test. show all your work!
Step1: State hypotheses
Let $\mu_1$ = mean score with music, $\mu_2$ = mean score without music.
Null: $H_0: \mu_1 = \mu_2$
Alternate: $H_a: \mu_1
eq \mu_2$
Step2: Calculate sample means
For "With Music" ($n_1=7$):
$\bar{x}_1 = \frac{82+88+79+85+90+84+87}{7} = \frac{595}{7} = 85$
For "Without Music" ($n_2=7$):
$\bar{x}_2 = \frac{75+78+72+80+76+74+79}{7} = \frac{534}{7} \approx 76.2857$
Step3: Calculate sample variances
For "With Music":
$s_1^2 = \frac{\sum_{i=1}^7 (x_{1i}-\bar{x}_1)^2}{n_1-1}$
$\sum (x_{1i}-\bar{x}_1)^2 = (82-85)^2+(88-85)^2+(79-85)^2+(85-85)^2+(90-85)^2+(84-85)^2+(87-85)^2$
$=9+9+36+0+25+1+4=84$
$s_1^2 = \frac{84}{6}=14$
For "Without Music":
$s_2^2 = \frac{\sum_{i=1}^7 (x_{2i}-\bar{x}_2)^2}{n_2-1}$
$\sum (x_{2i}-\bar{x}_2)^2 \approx (75-76.2857)^2+(78-76.2857)^2+(72-76.2857)^2+(80-76.2857)^2+(76-76.2857)^2+(74-76.2857)^2+(79-76.2857)^2$
$\approx 1.653+2.939+18.367+13.796+0.082+5.225+7.510=49.572$
$s_2^2 = \frac{49.572}{6} \approx 8.262$
Step4: Calculate pooled variance
$s_p^2 = \frac{(n_1-1)s_1^2 + (n_2-1)s_2^2}{n_1+n_2-2} = \frac{6*14 + 6*8.262}{12} = \frac{84+49.572}{12} = \frac{133.572}{12} \approx 11.131$
$s_p = \sqrt{11.131} \approx 3.336$
Step5: Calculate standard error
$SE = s_p \sqrt{\frac{1}{n_1}+\frac{1}{n_2}} = 3.336 \sqrt{\frac{1}{7}+\frac{1}{7}} = 3.336 \sqrt{\frac{2}{7}} \approx 3.336*0.5345 \approx 1.783$
Step6: Find t-critical value
For 95% confidence, $df = n_1+n_2-2=12$, $t_{0.025,12}=2.179$
Step7: Compute confidence interval
$\text{CI} = (\bar{x}_1 - \bar{x}_2) \pm t^* \times SE$
$\bar{x}_1 - \bar{x}_2 = 85 - 76.2857 = 8.7143$
$\text{CI} = 8.7143 \pm 2.179*1.783 \approx 8.7143 \pm 3.885$
Lower bound: $8.7143 - 3.885 \approx 4.83$
Upper bound: $8.7143 + 3.885 \approx 12.60$
Step8: Calculate t-test statistic
$t = \frac{\bar{x}_1 - \bar{x}_2}{SE} = \frac{8.7143}{1.783} \approx 4.887$
Step9: Compare to critical value
$|t|=4.887 > t_{0.025,12}=2.179$, so reject $H_0$.

Snap & solve any problem in the app
Get step-by-step solutions on Sovi AI
Photo-based solutions with guided steps
Explore more problems and detailed explanations
Hypotheses:
Null: $H_0: \mu_1 = \mu_2$ (The mean test scores are equal for students studying with and without music)
Alternate: $H_a: \mu_1
eq \mu_2$ (The mean test scores are significantly different for students studying with and without music)
95% Confidence Interval for $\mu_1 - \mu_2$:
$(4.83, 12.60)$
Hypothesis Test Result:
Reject the null hypothesis. There is sufficient evidence to conclude that the mean test score is significantly different between studying with music vs without music.