QUESTION IMAGE
Question
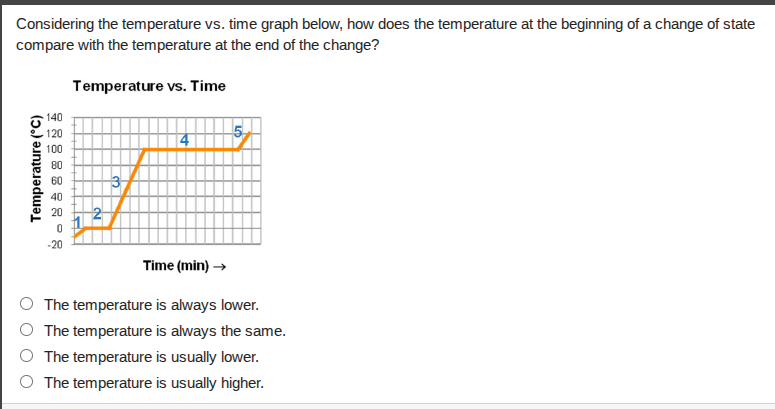
considering the temperature vs. time graph below, how does the temperature at the beginning of a change of state compare with the temperature at the end of the change?
temperature vs. time
time (min) →
○ the temperature is always lower.
○ the temperature is always the same.
○ the temperature is usually lower.
○ the temperature is usually higher.
On a temperature-time graph for a phase change, the flat segment (labeled 4 here) represents the change of state. During a phase change, heat energy is used to break or form intermolecular bonds rather than increasing or decreasing temperature, so the temperature remains constant from the start to the end of the phase change.

Snap & solve any problem in the app
Get step-by-step solutions on Sovi AI
Photo-based solutions with guided steps
Explore more problems and detailed explanations
The temperature is always the same.