QUESTION IMAGE
Question
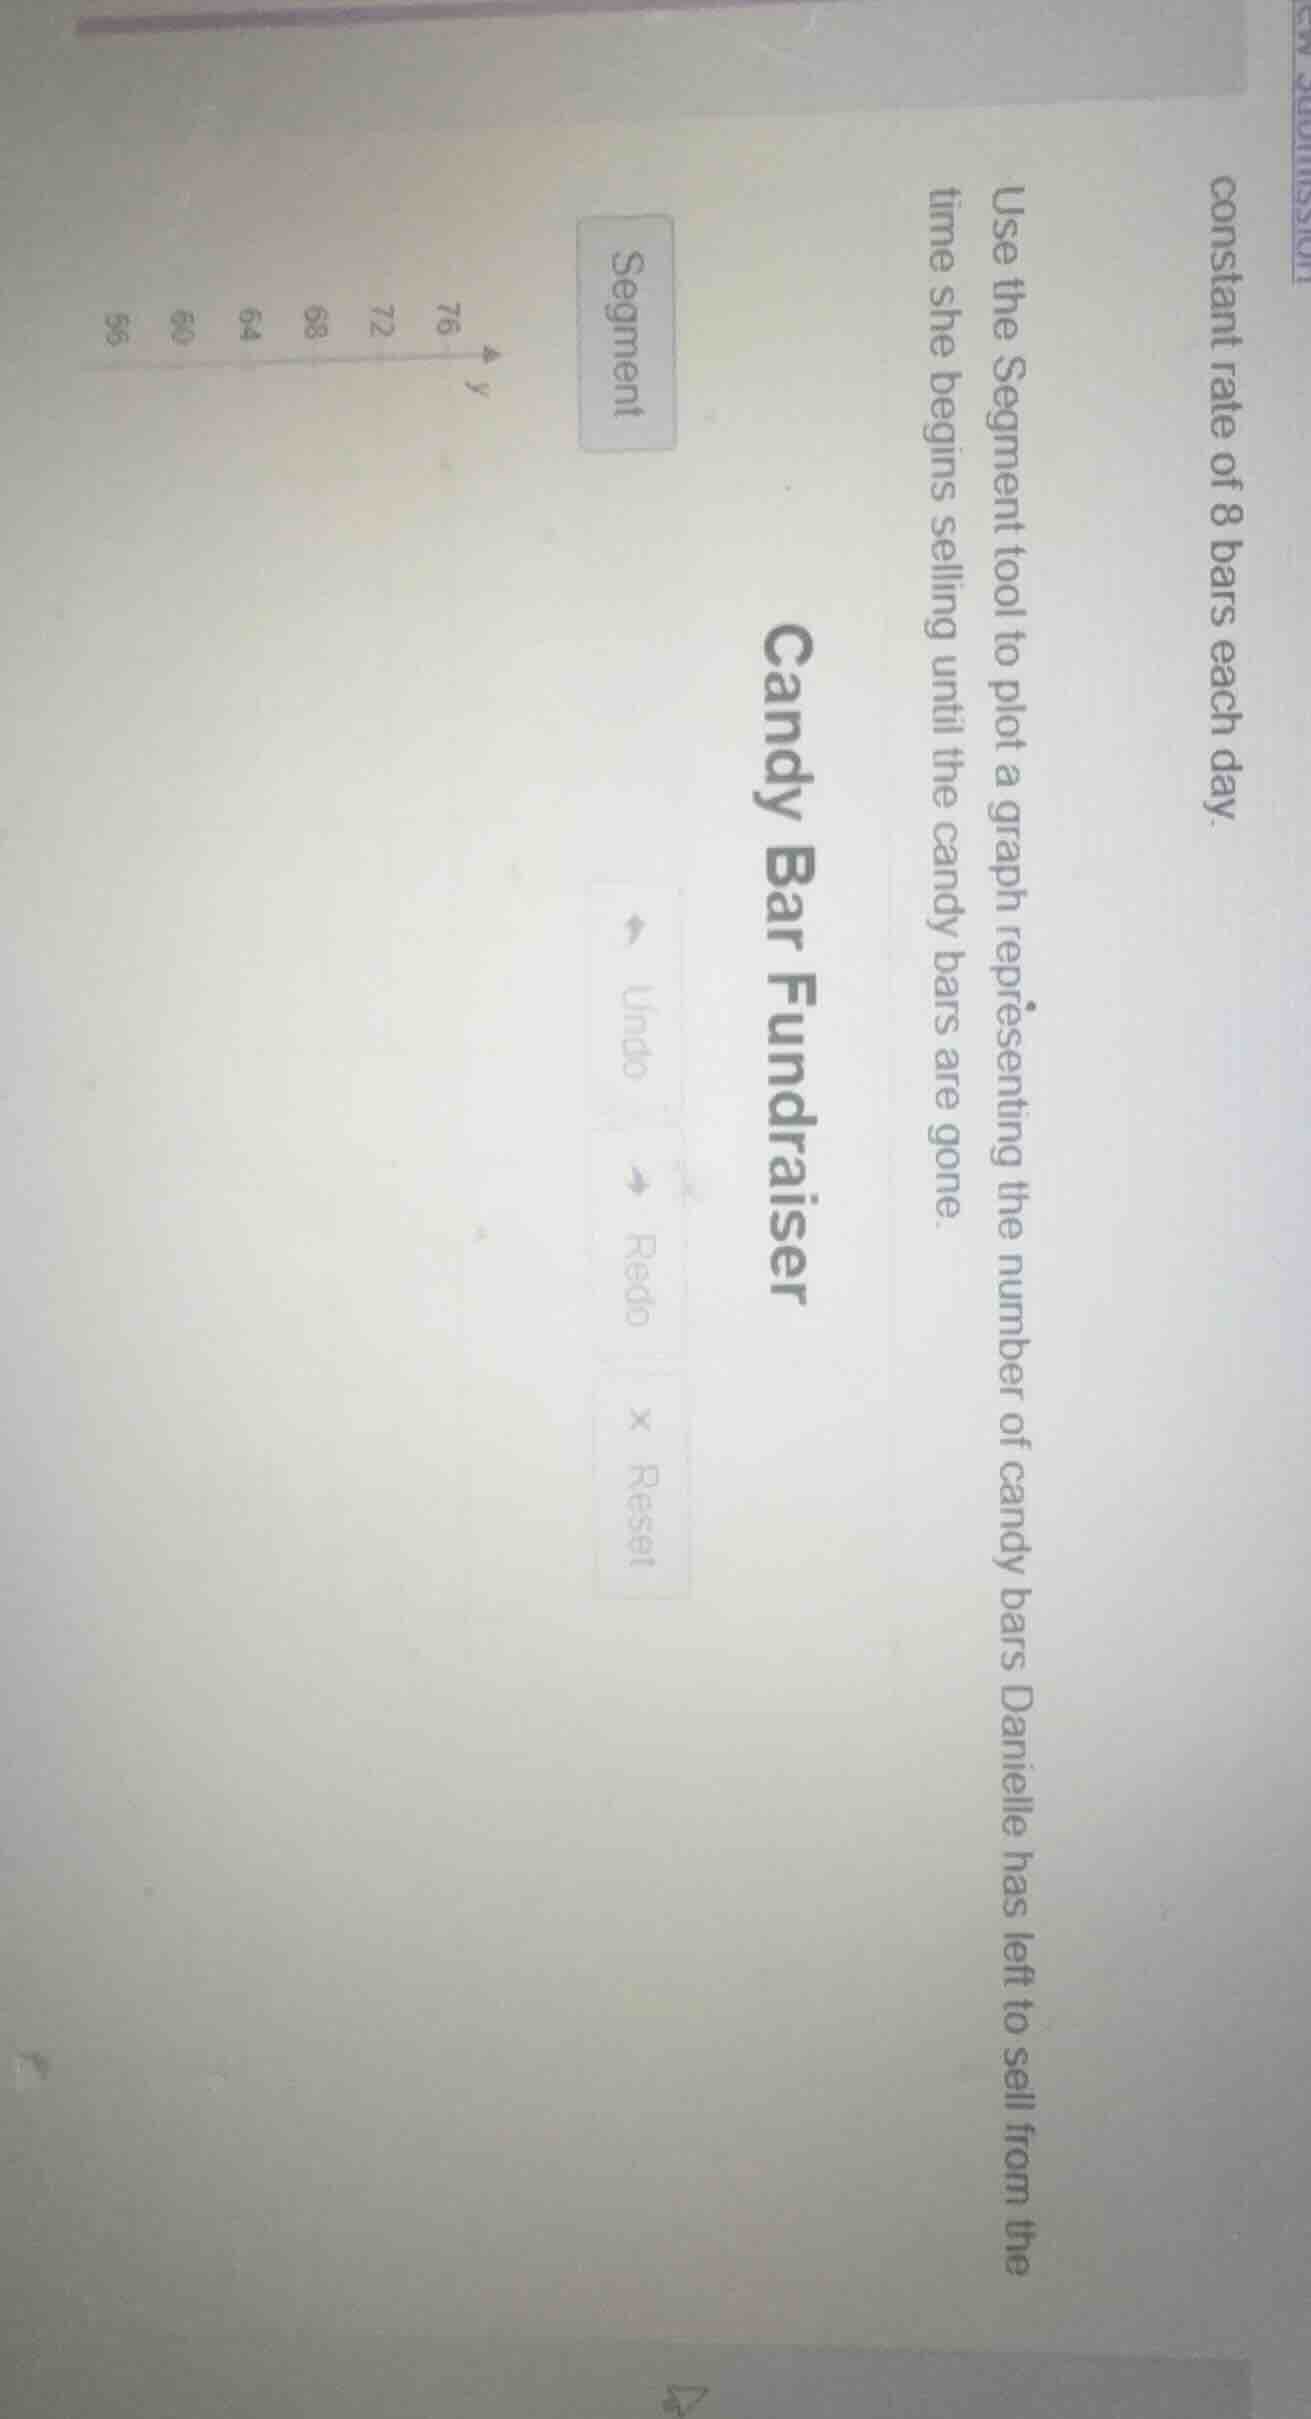
constant rate of 8 bars each day.
use the segment tool to plot a graph representing the number of candy bars danielle has left to sell from the time she begins selling until the candy bars are gone.
candy bar fundraiser
Step1: Identify initial candy count
The y-axis starts at 76, so initial $y=76$ (day 0, $x=0$). Point: $(0, 76)$
Step2: Calculate daily decrease
Sells 8 bars/day, so slope $m=-8$.
Step3: Find days to sell all bars
Set $y=0$, solve $0=76-8x$.
$8x=76$
$x=\frac{76}{8}=9.5$
End point: $(9.5, 0)$
Step4: Define the linear function
The equation is $y=76-8x$

Snap & solve any problem in the app
Get step-by-step solutions on Sovi AI
Photo-based solutions with guided steps
Explore more problems and detailed explanations
Plot a line segment connecting the points $(0, 76)$ and $(9.5, 0)$, where the x-axis represents days and the y-axis represents remaining candy bars.