QUESTION IMAGE
Question
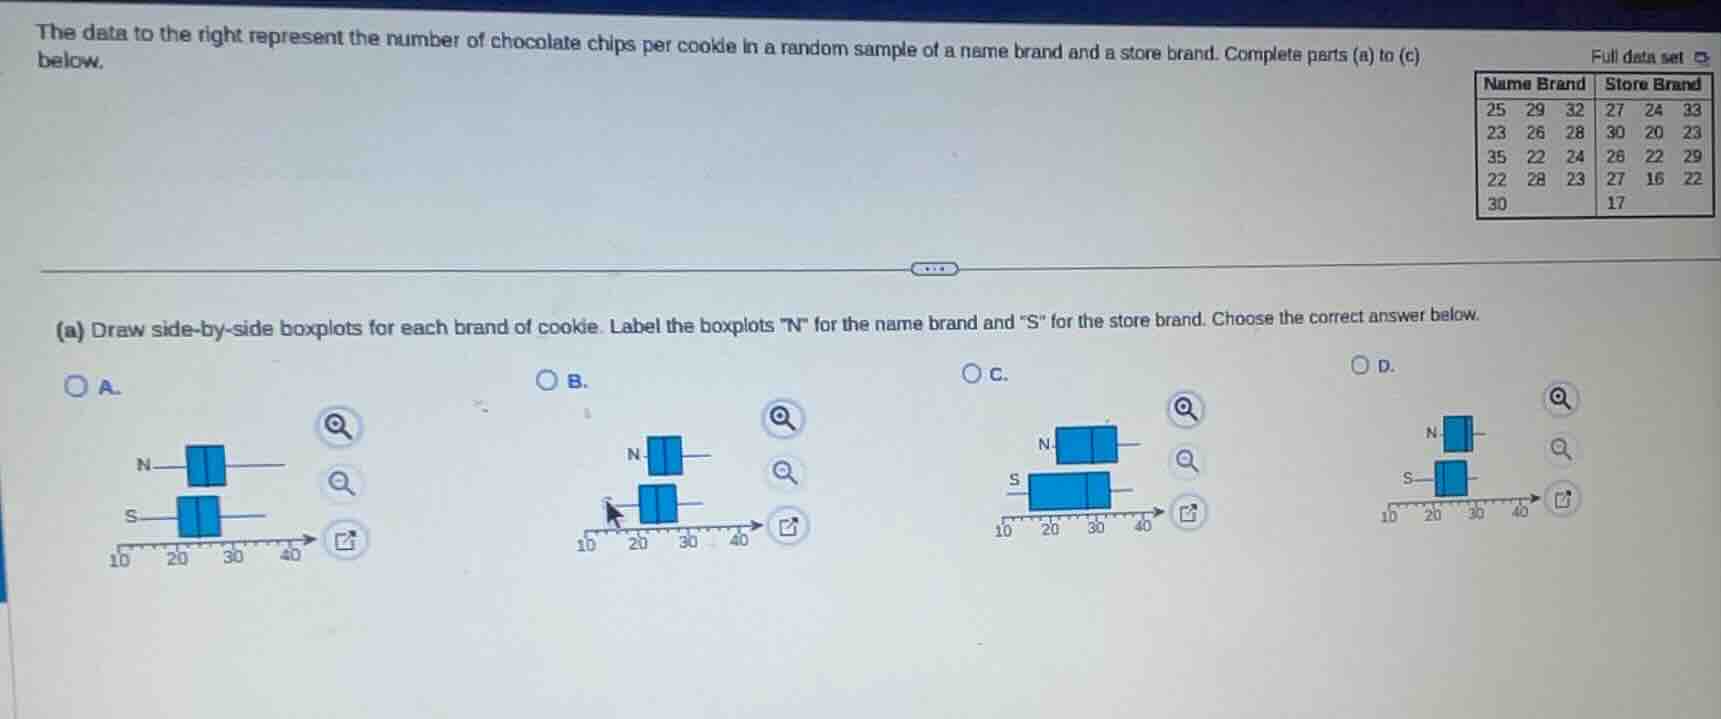
the data to the right represent the number of chocolate chips per cookie in a random sample of a name brand and a store brand. complete parts (a) to (c) below.
full data set
name brand store brand
25 29 32 27 24 33
23 26 28 30 20 23
35 22 24 26 22 29
22 28 23 27 16 22
30 17
(a) draw side-by-side boxplots for each brand of cookie. label the boxplots
\ for the name brand and \s\ for the store brand. choose the correct answer below.
a.
b.
c.
d.
Step1: Calculate Name Brand stats
First, sort Name Brand data: 22, 23, 25, 26, 28, 29, 30, 32, 35
- Min = 22, Q1 = 24, Median = 28, Q3 = 31, Max = 35
Step2: Calculate Store Brand stats
Sort Store Brand data: 16, 17, 20, 22, 22, 23, 24, 26, 27, 29, 30
- Min = 16, Q1 = 20, Median = 23, Q3 = 27, Max = 30
Step3: Match to boxplot
Name Brand has higher overall values (min 22 vs store's 16, median 28 vs 23, max 35 vs 30). Only option A has Name Brand (N) boxplot shifted right compared to Store Brand (S), matching the stats.

Snap & solve any problem in the app
Get step-by-step solutions on Sovi AI
Photo-based solutions with guided steps
Explore more problems and detailed explanations
A. <The boxplot with "N" (name brand) shifted right of "S" (store brand), with N's range ~22-35 and S's range ~16-30>