QUESTION IMAGE
Question
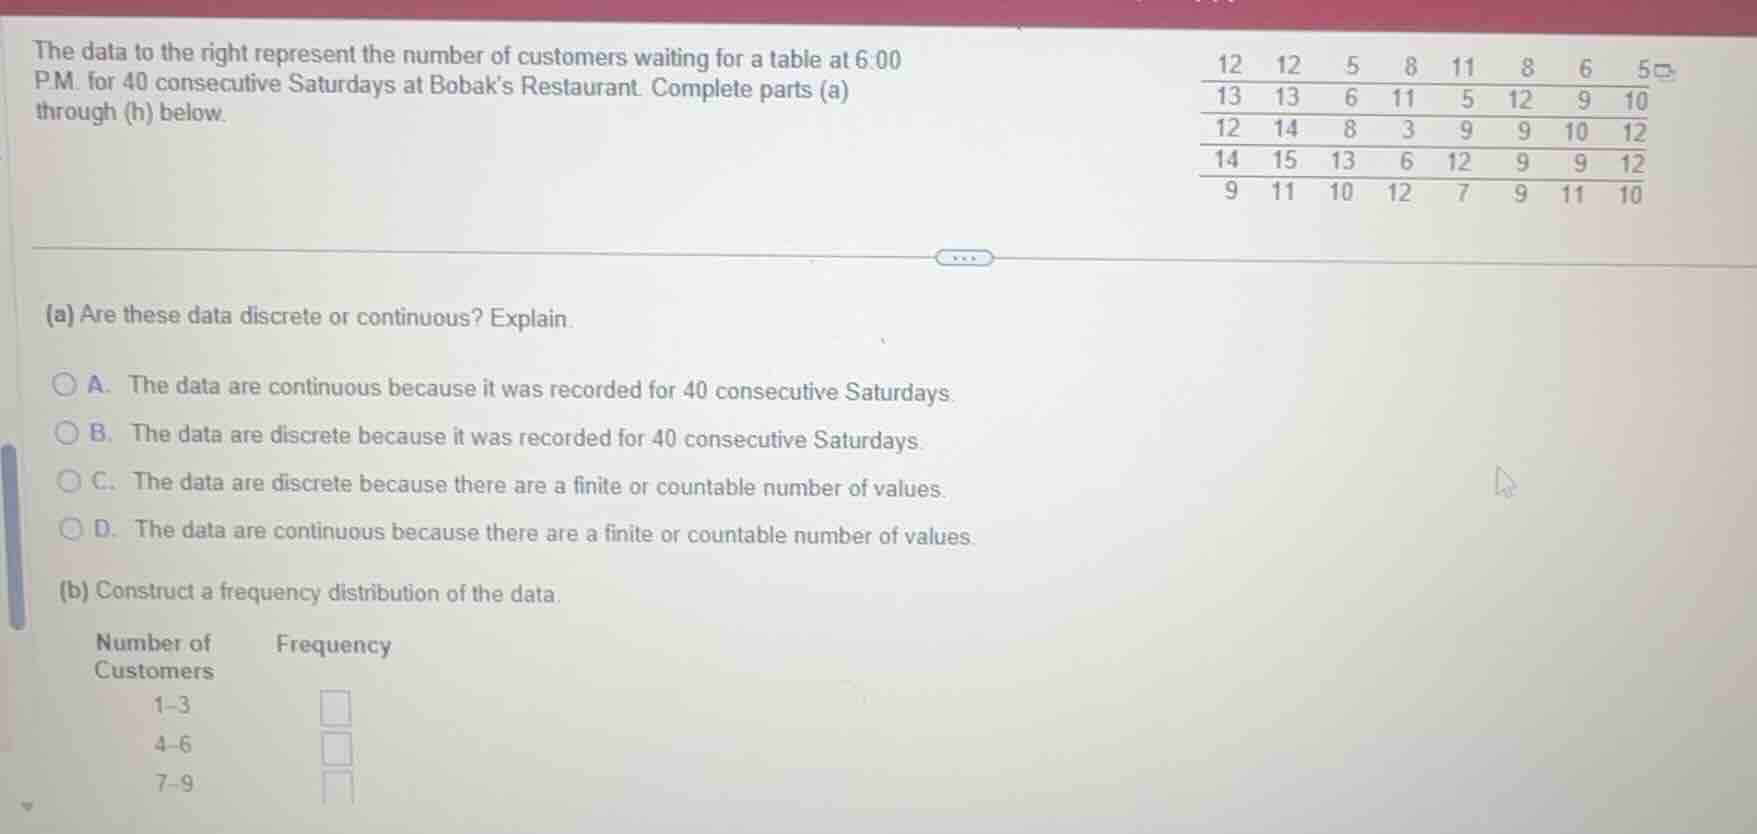
the data to the right represent the number of customers waiting for a table at 6:00 p.m. for 40 consecutive saturdays at bobak’s restaurant. complete parts (a) through (h) below. 12 12 5 8 11 8 6 5 13 13 6 11 5 12 9 10 12 14 8 3 9 9 10 12 14 15 13 6 12 9 9 12 9 11 10 12 7 9 11 10 (a) are these data discrete or continuous? explain. a. the data are continuous because it was recorded for 40 consecutive saturdays. b. the data are discrete because it was recorded for 40 consecutive saturdays. c. the data are discrete because there are a finite or countable number of values. d. the data are continuous because there are a finite or countable number of values. (b) construct a frequency distribution of the data. number of customers frequency 1–3 4–6 7–9
Part (a)
Discrete data consists of countable, distinct values, while continuous data can take any value in a range. The number of waiting customers is a countable, finite set of values.
Step1: Count values 1-3
Identify values in 1-3: 3. Count = 1
Step2: Count values 4-6
Identify values in 4-6: 5,5,6,5,6,6. Count = 6
Step3: Count values 7-9
Identify values in 7-9: 8,8,9,8,9,9,9,7,9. Count = 9

Snap & solve any problem in the app
Get step-by-step solutions on Sovi AI
Photo-based solutions with guided steps
Explore more problems and detailed explanations
C. The data are discrete because there are a finite or countable number of values.
---