QUESTION IMAGE
Question
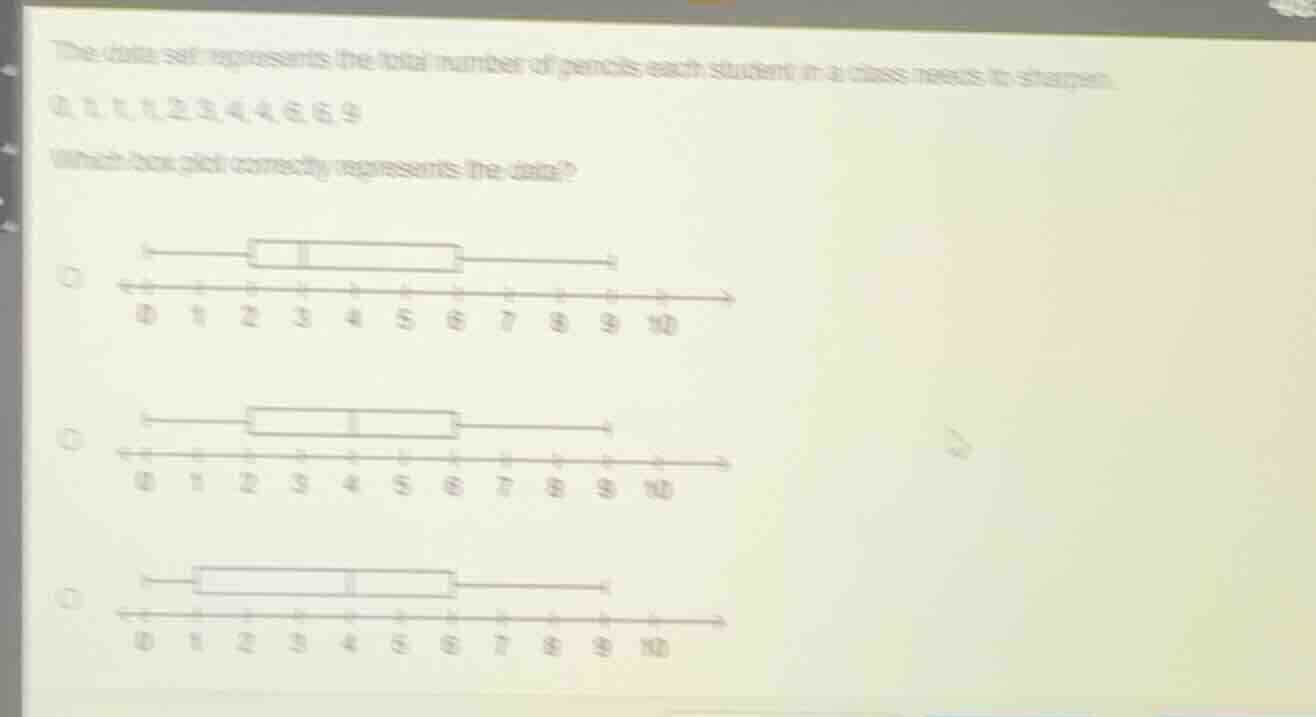
the data set represents the total number of pencils each student in a class needs to sharpen. 0, 1, 1, 1, 2, 3, 4, 4, 6, 6, 9 which box plot correctly represents the data? three box plot options are shown with number lines from 0 to 10
Step1: Find the minimum, Q1, median, Q3, maximum
The data set is: 0, 1, 1, 1, 2, 3, 4, 4, 6, 6, 9.
- Minimum ($\text{min}$) = 0.
- Number of data points $n = 11$ (odd). Median is the $\frac{n + 1}{2} = 6^{\text{th}}$ term. The $6^{\text{th}}$ term is 3, so median = 3.
- To find Q1 (first quartile), consider the lower half: 0, 1, 1, 1, 2 (first 5 terms). Q1 is the median of this subset, which is the $3^{\text{rd}}$ term: 1.
- To find Q3 (third quartile), consider the upper half: 4, 4, 6, 6, 9 (last 5 terms). Q3 is the median of this subset, which is the $3^{\text{rd}}$ term: 6.
- Maximum ($\text{max}$) = 9.
Step2: Analyze the box - plot components
A box - plot has:
- Whisker from min (0) to Q1 (1).
- Box from Q1 (1) to Q3 (6), with median (3) inside the box.
- Whisker from Q3 (6) to max (9).
Now let's check the options:
- First option: The left whisker should go from 0 to Q1 (1). The box starts at Q1 (1) and ends at Q3 (6), median at 3, and right whisker to 9. This matches our calculations.
- Second option: If we recalculate, our Q1 is 1, Q3 is 6, median is 3. The second option's box and whiskers do not match these values.
- Third option: The left whisker starts at 0, but the box starts at 1? No, our Q1 is 1, but the third option's left whisker is from 0 to 1 (which is correct for the left whisker), but the box in the third option starts at 1? Wait, no, let's re - evaluate. Wait, the first option: min = 0, Q1 = 1, median = 3, Q3 = 6, max = 9. So the left whisker is from 0 to 1, box from 1 to 6, median at 3, right whisker from 6 to 9. The first option's box - plot: the left whisker is from 0 to 1 (since the dot for min is 0 and the start of the box is 1), the box is from 1 to 6, median at 3, and right whisker from 6 to 9. This matches. The other options have incorrect Q1, Q3, or median positions.

Snap & solve any problem in the app
Get step-by-step solutions on Sovi AI
Photo-based solutions with guided steps
Explore more problems and detailed explanations
The first box - plot (the one with min = 0, Q1 = 1, median = 3, Q3 = 6, max = 9)