QUESTION IMAGE
Question
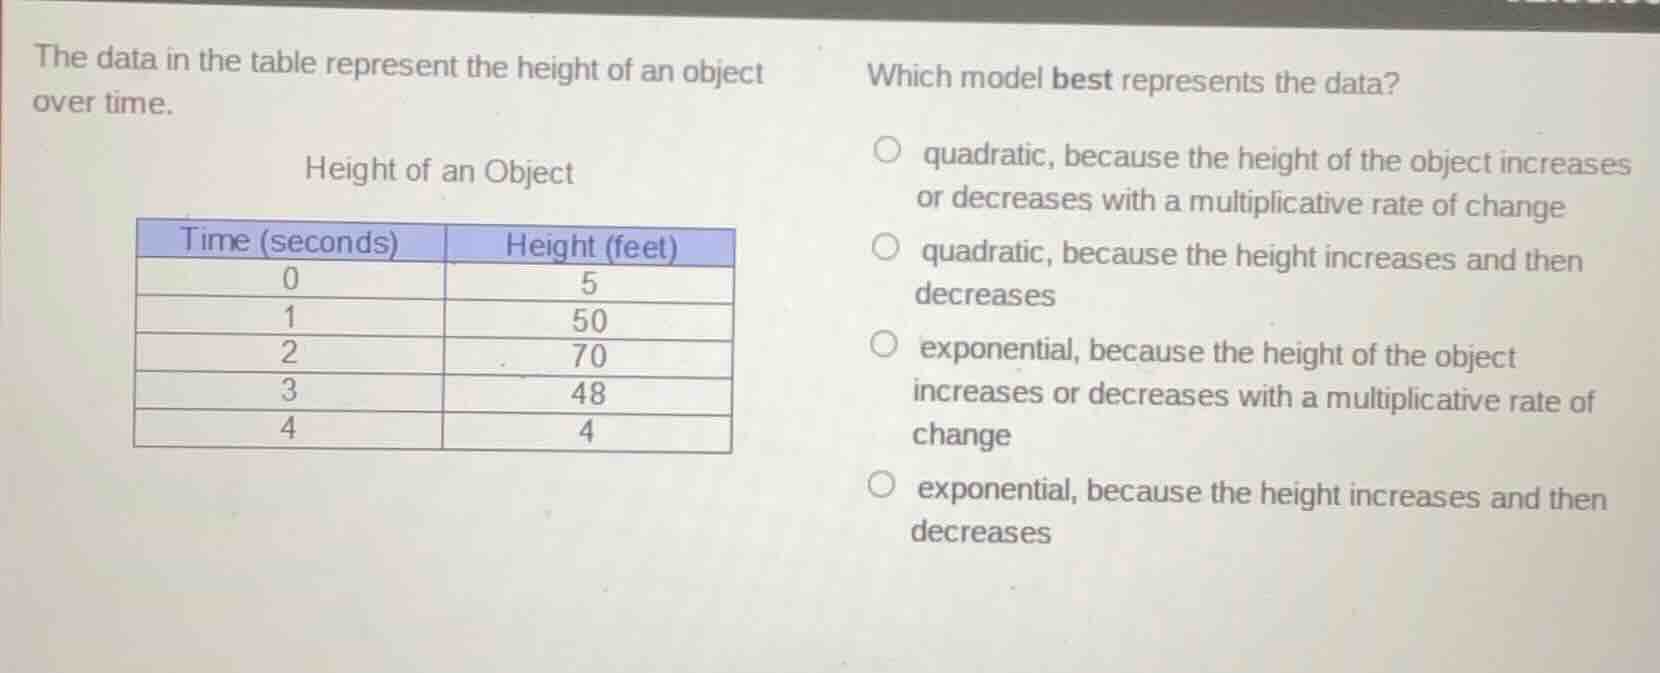
the data in the table represent the height of an object over time.
height of an object
| time (seconds) | height (feet) |
|---|---|
| 1 | 50 |
| 2 | 70 |
| 3 | 48 |
| 4 | 4 |
which model best represents the data?
- quadratic, because the height of the object increases or decreases with a multiplicative rate of change
- quadratic, because the height increases and then decreases
- exponential, because the height of the object increases or decreases with a multiplicative rate of change
- exponential, because the height increases and then decreases
First, analyze the data trend: height rises from 5 ft (0s) to 70 ft (2s), then falls to 4 ft (4s), forming a symmetric-like curve typical of quadratic motion (e.g., projectile motion). Exponential models have multiplicative constant rates of change, which this data does not show (the changes between time steps are not multiplicative: 5→50 is ×10, 50→70 is ×1.4, not consistent). Quadratic models often describe quantities that increase then decrease (or vice versa) with a parabolic trend, matching this data.

Snap & solve any problem in the app
Get step-by-step solutions on Sovi AI
Photo-based solutions with guided steps
Explore more problems and detailed explanations
quadratic, because the height increases and then decreases