QUESTION IMAGE
Question
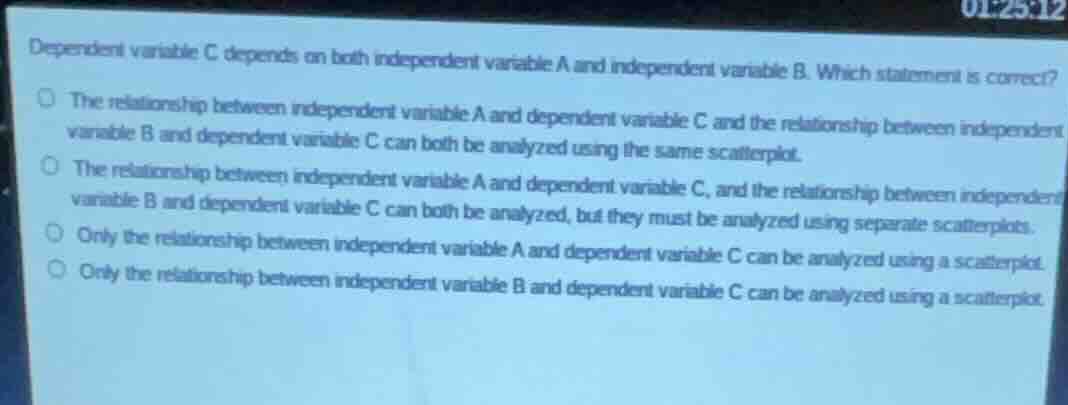
dependent variable c depends on both independent variable a and independent variable b. which statement is correct?
- the relationship between independent variable a and dependent variable c and the relationship between independent variable b and dependent variable c can both be analyzed using the same scatterplot.
- the relationship between independent variable a and dependent variable c, and the relationship between independent variable b and dependent variable c can both be analyzed, but they must be analyzed using separate scatterplots.
- only the relationship between independent variable a and dependent variable c can be analyzed using a scatterplot.
- only the relationship between independent variable b and dependent variable c can be analyzed using a scatterplot.
<pre_analysis>
{
"quality": "clear",
"question_count": 1,
"skills_matched": [
"direct_cot",
"multiple_choice_formatter",
"explain_then_answer",
"tutor"
],
"needs_drawing": false,
"concepts_used": [
"Variable Association"
],
"new_concepts": [
"Bivariate Data Analysis",
"Scatter Plot Limitations"
],
"current_concepts": [
"Variable Association",
"Scatter Plot Trends",
"Bivariate Data Analysis",
"Scatter Plot Limitations"
]
}
</pre_analysis>
<reasoning>
Analyze scatter plot dimensions
A standard scatter plot is designed to display and analyze bivariate data. This means it visualizes the relationship between exactly two variables at a time, typically represented on the horizontal \(x\)-axis and vertical \(y\)-axis.
Evaluate variable relationships
The problem states that dependent variable \(C\) depends on two separate independent variables, \(A\) and \(B\). To analyze how \(C\) relates to \(A\), and how \(C\) relates to \(B\), we are looking at two distinct bivariate relationships:
- The relationship between independent variable \(A\) and dependent variable \(C\).
- The relationship between independent variable \(B\) and dependent variable \(C\).
Determine visualization requirements
Using the concept of Variable Association, we know that to properly observe the association between two variables, we must isolate them. Because a single standard scatter plot can only map one independent variable to one dependent variable, we cannot analyze both relationships on the same scatter plot without confounding the variables. Therefore, they must be analyzed using separate scatter plots: one for \(A\) and \(C\), and another for \(B\) and \(C\).
Compare with given options
- Option 1 suggests both relationships can be analyzed on the same scatter plot, which is incorrect because a standard scatter plot only handles two variables.
- Option 2 correctly states that both relationships can be analyzed, but they must be analyzed using separate scatter plots.
- Options 3 and 4 incorrectly suggest that only one of the relationships can be analyzed using a scatter plot.
</reasoning>
<answer>
<mcq-option>(A) The relationship between independent variable A and dependent variable C and the relationship between independent variable B and dependent variable C can both be analyzed using the same scatterplot.</mcq-option>
<mcq-correct>(B) The relationship between independent variable A and dependent variable C, and the relationship between independent variable B and dependent variable C can both be analyzed, but they must be analyzed using separate scatterplots.</mcq-correct>
<mcq-option>(C) Only the relationship between independent variable A and dependent variable C can be analyzed using a scatterplot.</mcq-option>
<mcq-option>(D) Only the relationship between independent variable B and dependent variable C can be analyzed using a scatterplot.</mcq-option>
</answer>
<post_analysis>
{
"subject": "Mathematics",
"question_type": "Multiple Choice",
"knowledge_point": [
"Mathematics",
"Statistics",
"Bivariate Data Analysis"
]
}
</post_analysis>

Snap & solve any problem in the app
Get step-by-step solutions on Sovi AI
Photo-based solutions with guided steps
Explore more problems and detailed explanations
<pre_analysis>
{
"quality": "clear",
"question_count": 1,
"skills_matched": [
"direct_cot",
"multiple_choice_formatter",
"explain_then_answer",
"tutor"
],
"needs_drawing": false,
"concepts_used": [
"Variable Association"
],
"new_concepts": [
"Bivariate Data Analysis",
"Scatter Plot Limitations"
],
"current_concepts": [
"Variable Association",
"Scatter Plot Trends",
"Bivariate Data Analysis",
"Scatter Plot Limitations"
]
}
</pre_analysis>
<reasoning>
Analyze scatter plot dimensions
A standard scatter plot is designed to display and analyze bivariate data. This means it visualizes the relationship between exactly two variables at a time, typically represented on the horizontal \(x\)-axis and vertical \(y\)-axis.
Evaluate variable relationships
The problem states that dependent variable \(C\) depends on two separate independent variables, \(A\) and \(B\). To analyze how \(C\) relates to \(A\), and how \(C\) relates to \(B\), we are looking at two distinct bivariate relationships:
- The relationship between independent variable \(A\) and dependent variable \(C\).
- The relationship between independent variable \(B\) and dependent variable \(C\).
Determine visualization requirements
Using the concept of Variable Association, we know that to properly observe the association between two variables, we must isolate them. Because a single standard scatter plot can only map one independent variable to one dependent variable, we cannot analyze both relationships on the same scatter plot without confounding the variables. Therefore, they must be analyzed using separate scatter plots: one for \(A\) and \(C\), and another for \(B\) and \(C\).
Compare with given options
- Option 1 suggests both relationships can be analyzed on the same scatter plot, which is incorrect because a standard scatter plot only handles two variables.
- Option 2 correctly states that both relationships can be analyzed, but they must be analyzed using separate scatter plots.
- Options 3 and 4 incorrectly suggest that only one of the relationships can be analyzed using a scatter plot.
</reasoning>
<answer>
<mcq-option>(A) The relationship between independent variable A and dependent variable C and the relationship between independent variable B and dependent variable C can both be analyzed using the same scatterplot.</mcq-option>
<mcq-correct>(B) The relationship between independent variable A and dependent variable C, and the relationship between independent variable B and dependent variable C can both be analyzed, but they must be analyzed using separate scatterplots.</mcq-correct>
<mcq-option>(C) Only the relationship between independent variable A and dependent variable C can be analyzed using a scatterplot.</mcq-option>
<mcq-option>(D) Only the relationship between independent variable B and dependent variable C can be analyzed using a scatterplot.</mcq-option>
</answer>
<post_analysis>
{
"subject": "Mathematics",
"question_type": "Multiple Choice",
"knowledge_point": [
"Mathematics",
"Statistics",
"Bivariate Data Analysis"
]
}
</post_analysis>