QUESTION IMAGE
Question
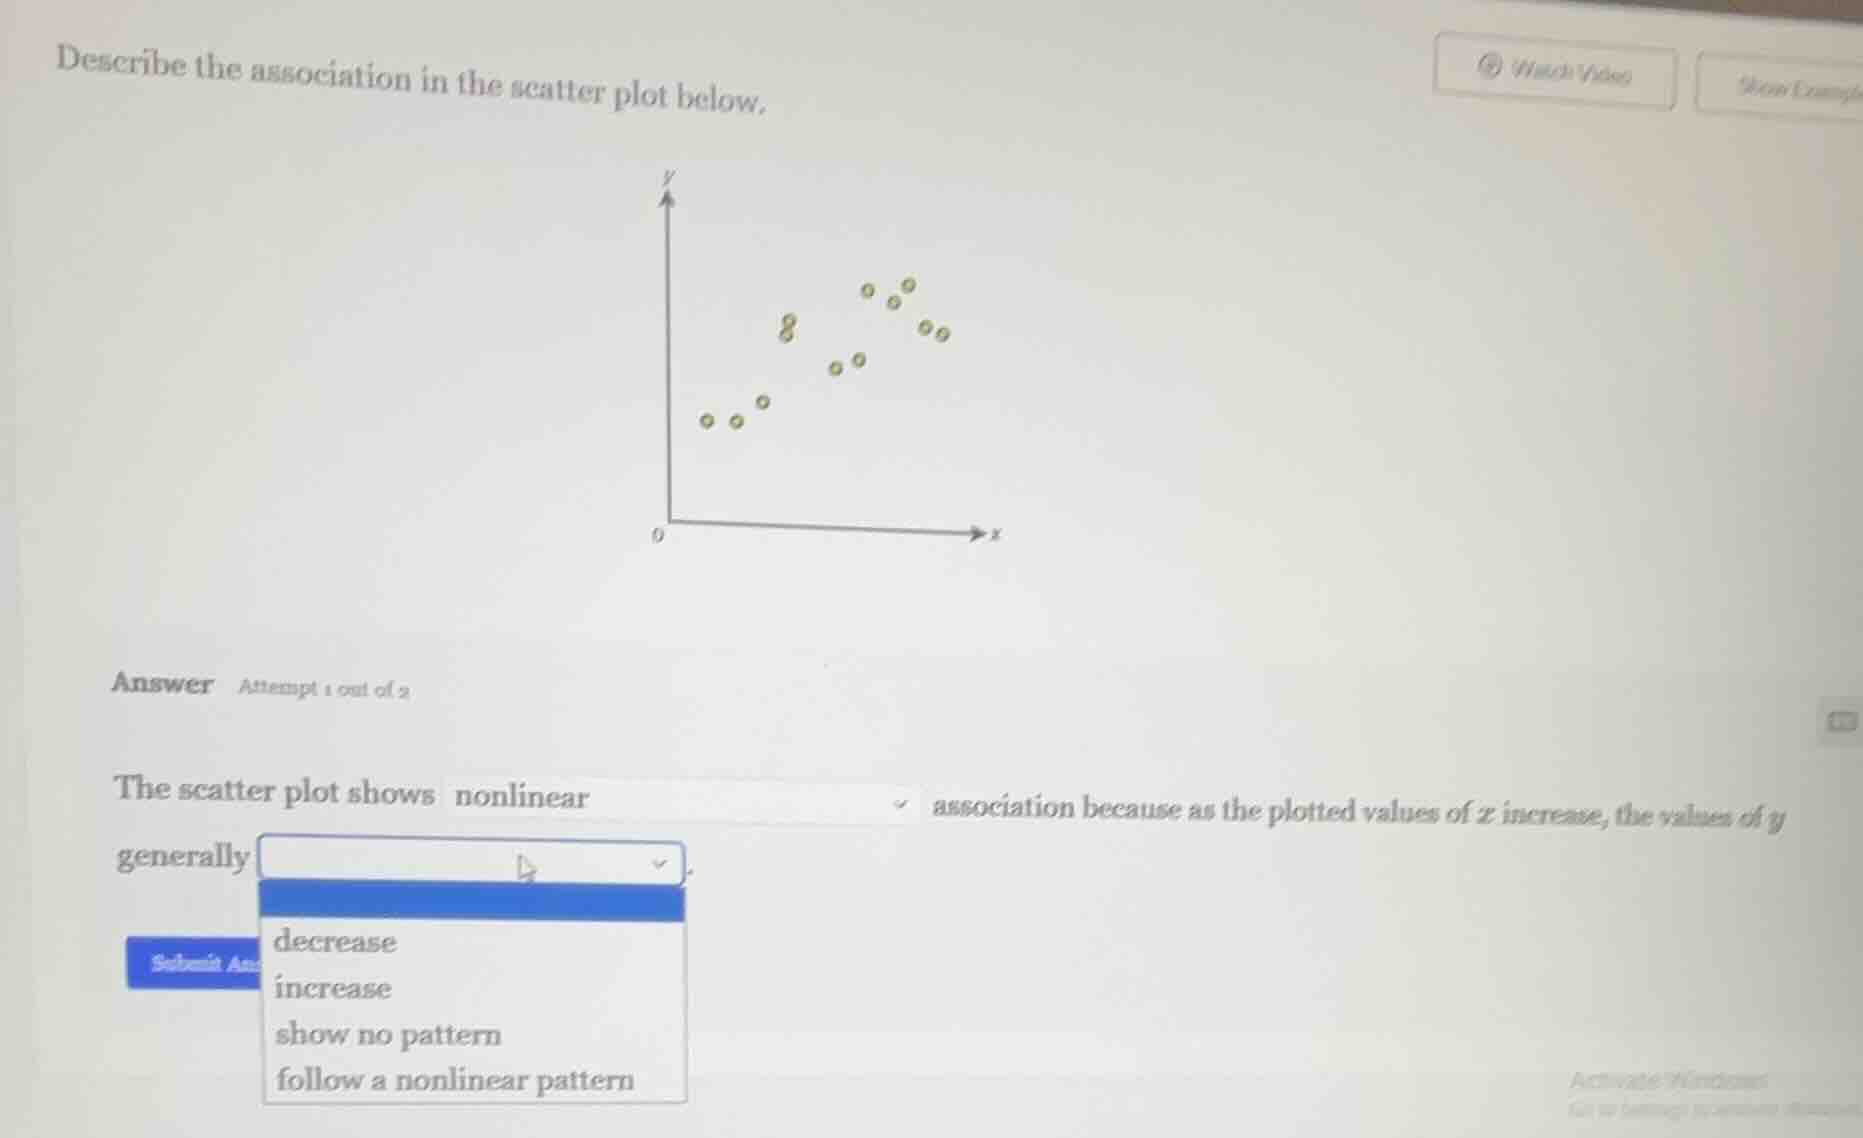
describe the association in the scatter plot below.
the scatter plot shows nonlinear association because as the plotted values of x increase, the values of y generally
options: decrease, increase, show no pattern, follow a nonlinear pattern
Brief Explanations
The scatter plot has points that first rise as x increases, forming a curve, then fall, which is a curved (nonlinear) pattern rather than a steady increase/decrease or no pattern.

Snap & solve any problem in the app
Get step-by-step solutions on Sovi AI
Photo-based solutions with guided steps
Explore more problems and detailed explanations
The scatter plot shows nonlinear association because as the plotted values of $x$ increase, the values of $y$ generally follow a nonlinear pattern