QUESTION IMAGE
Question
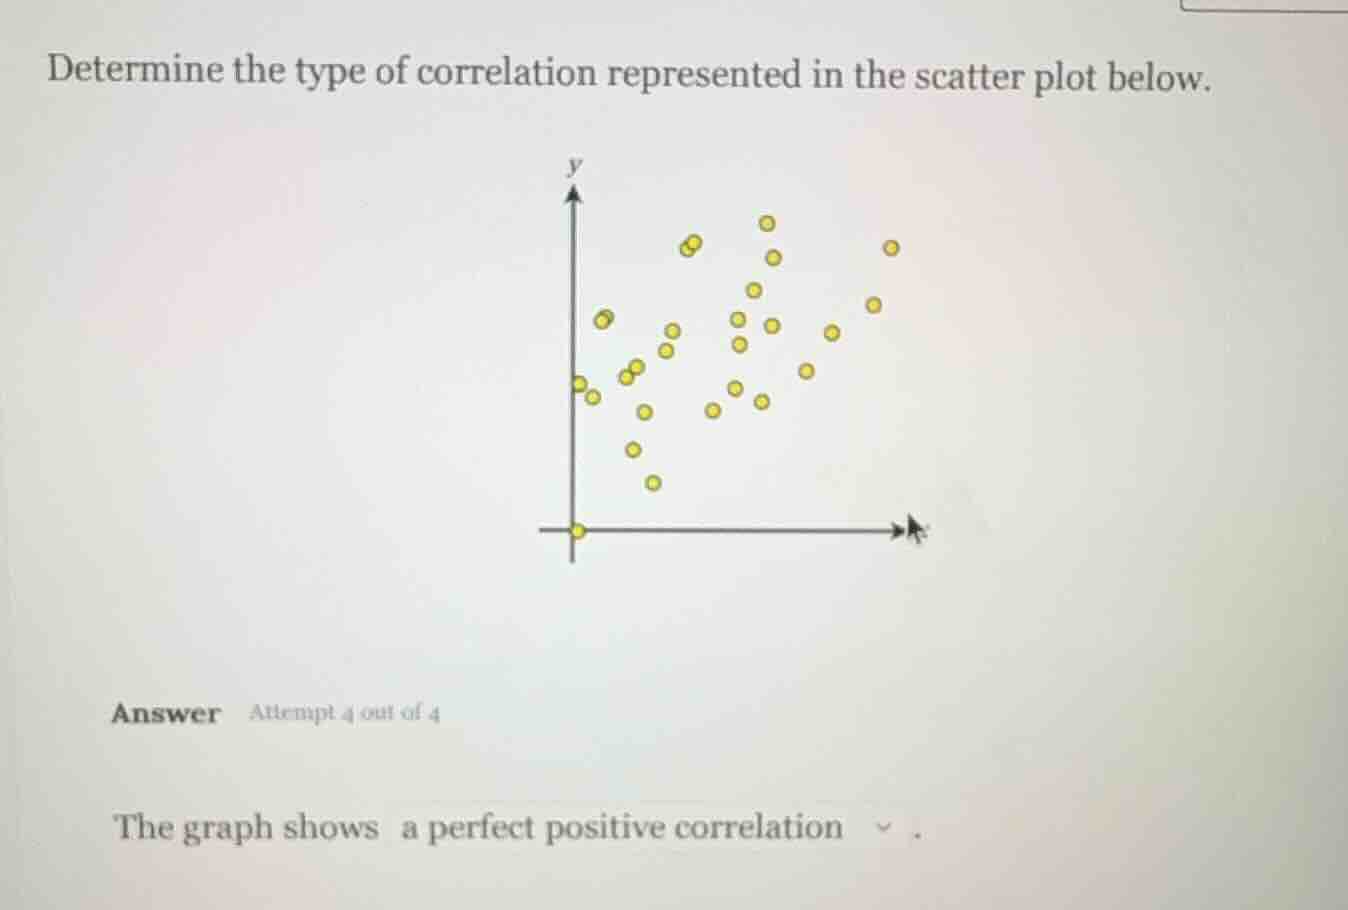
determine the type of correlation represented in the scatter plot below.
the graph shows a perfect positive correlation
Brief Explanations
The scatter plot shows that as the values on the x-axis increase, the values on the y-axis generally increase, but the points are not perfectly aligned in a straight line, so it is not a perfect positive correlation. This pattern indicates a general upward trend, which is a positive correlation.

Snap & solve any problem in the app
Get step-by-step solutions on Sovi AI
Photo-based solutions with guided steps
Explore more problems and detailed explanations
The graph shows a positive (non-perfect) correlation