QUESTION IMAGE
Question
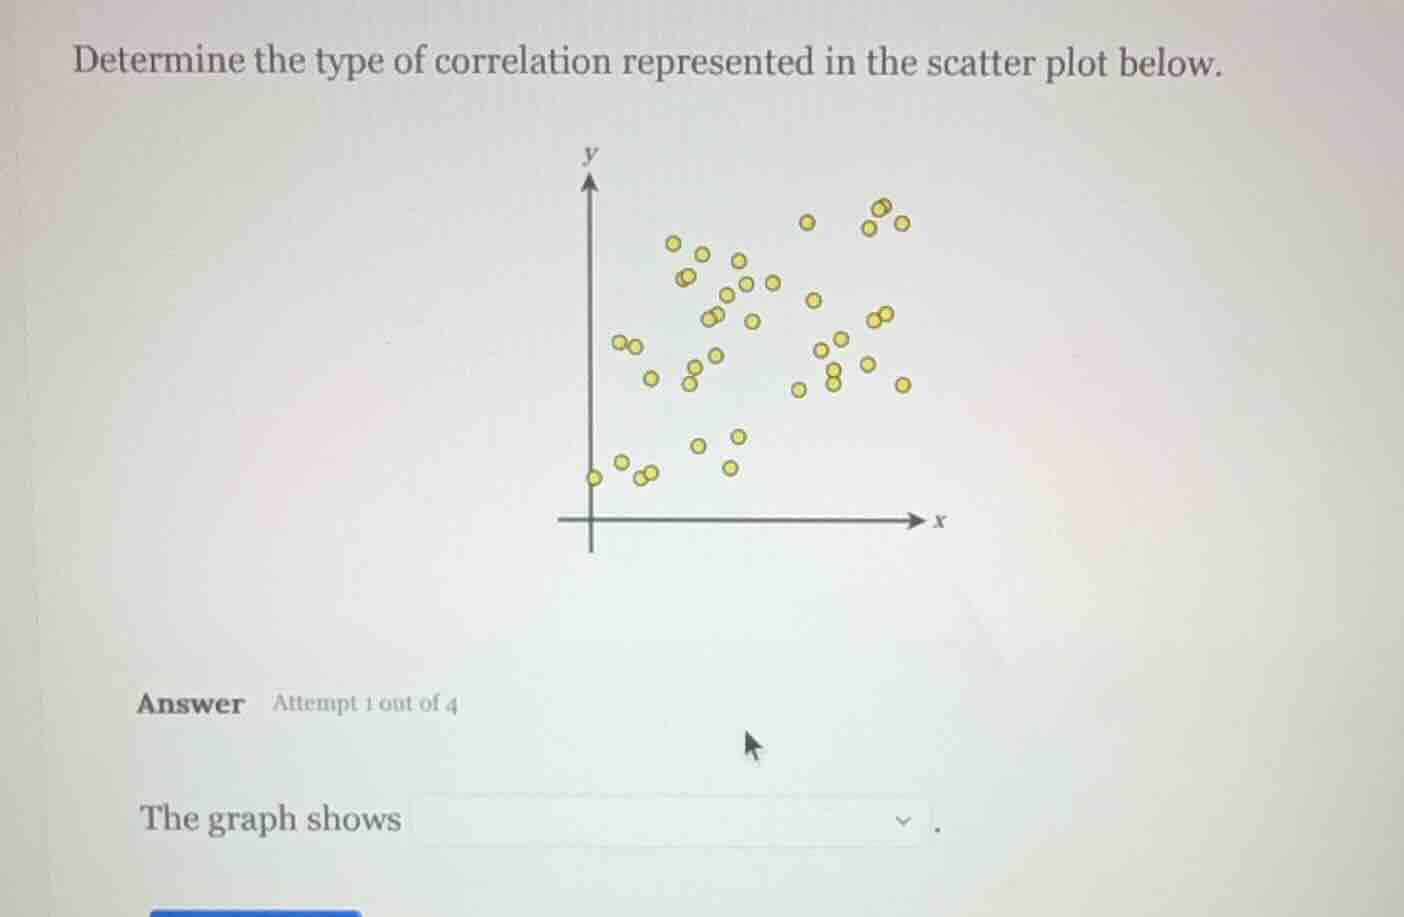
determine the type of correlation represented in the scatter plot below.
the graph shows .
Brief Explanations
Al observar el diagrama de dispersión, se nota que a medida que el valor de la variable $x$ aumenta, el valor de la variable $y$ también tiende a aumentar, aunque los puntos no forman una línea perfecta. Esto corresponde a una correlación positiva débil o moderada.

Snap & solve any problem in the app
Get step-by-step solutions on Sovi AI
Photo-based solutions with guided steps
Explore more problems and detailed explanations
a weak positive correlation (correlación positiva débil)