QUESTION IMAGE
Question
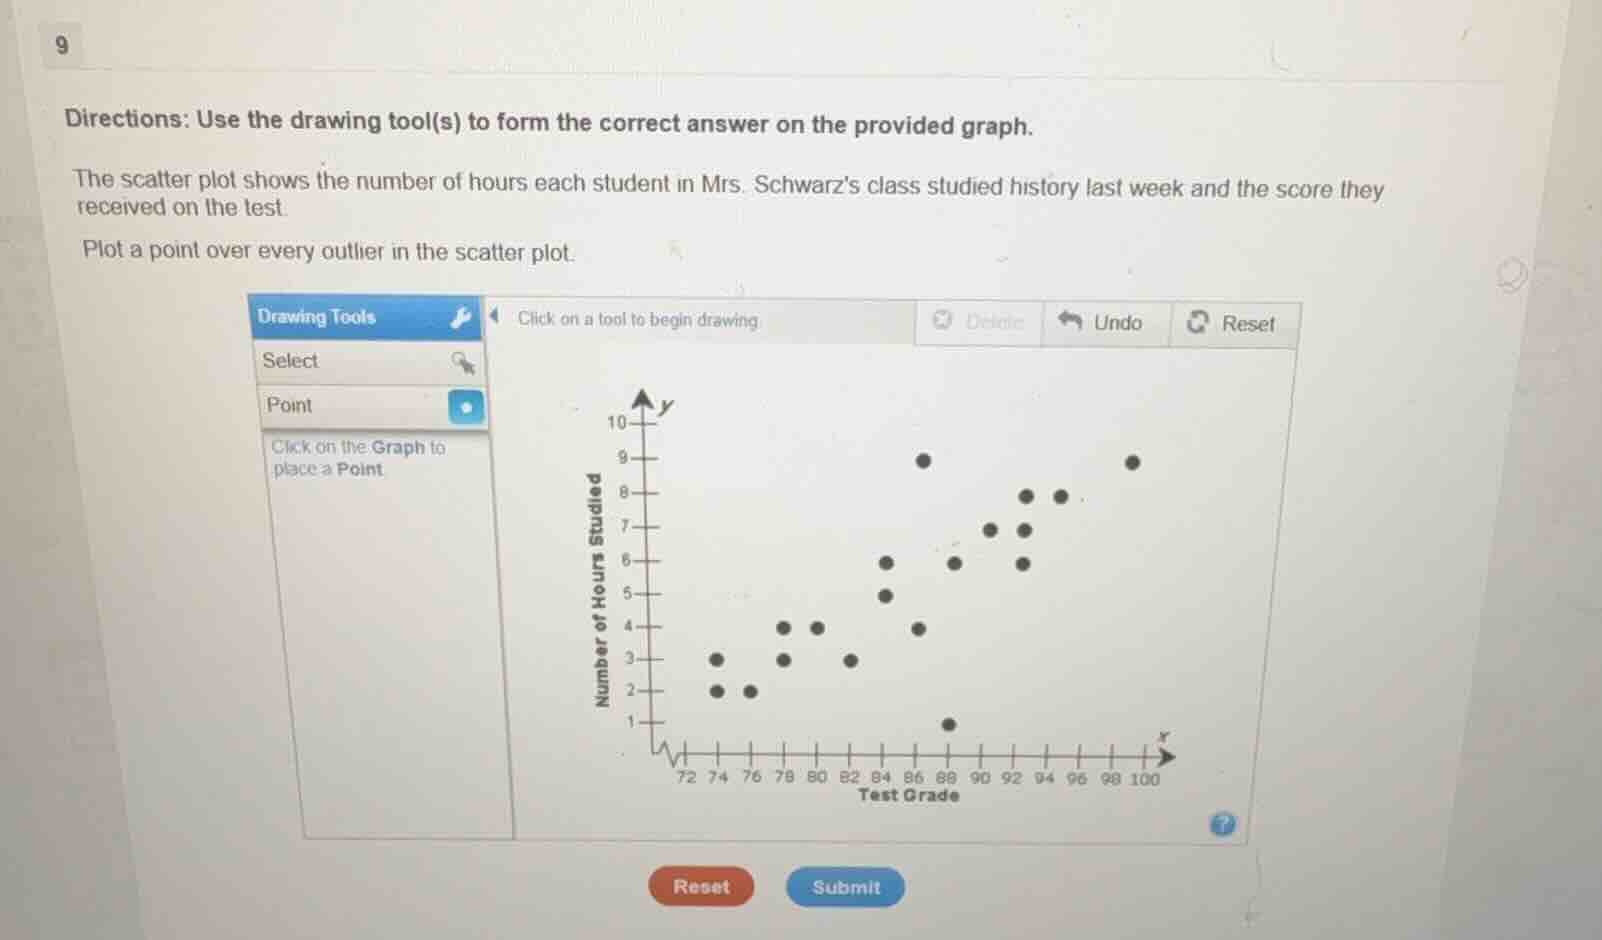
directions: use the drawing tool(s) to form the correct answer on the provided graph. the scatter plot shows the number of hours each student in mrs. schwarzs class studied history last week and the score they received on the test. plot a point over every outlier in the scatter plot.
An outlier is a point that lies far outside the general pattern of the other data points. In this scatter plot, the point at (88, 1) is far removed from the cluster of other points (all other points have higher hours studied for their test grades, and this point has an extremely low number of study hours for a relatively high test grade, breaking the general trend).

Snap & solve any problem in the app
Get step-by-step solutions on Sovi AI
Photo-based solutions with guided steps
Explore more problems and detailed explanations
Plot a point over the coordinate $(88, 1)$ (the point with test grade 88 and 1 hour studied).