QUESTION IMAGE
Question
discovered in modern times.
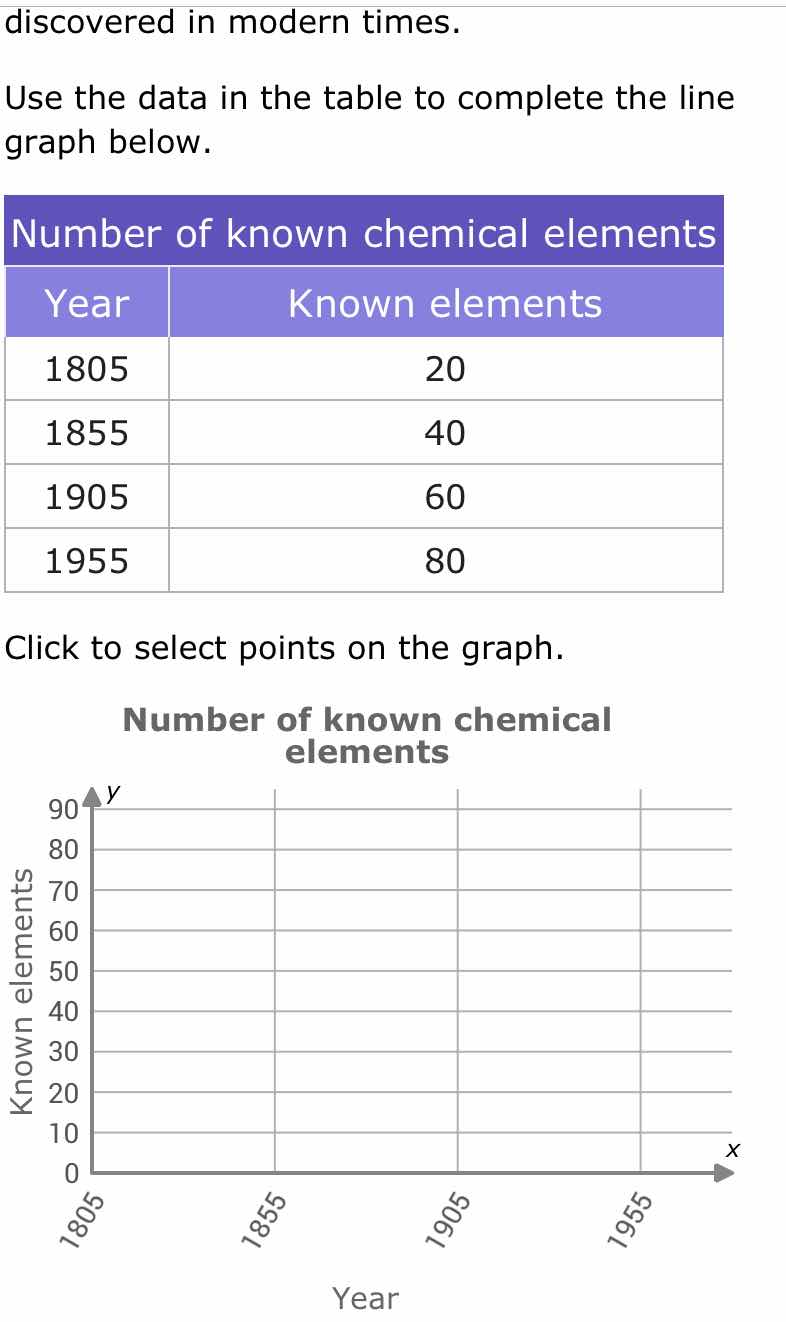
use the data in the table to complete the line graph below.
number of known chemical elements
| year | known elements |
|---|---|
| 1855 | 40 |
| 1905 | 60 |
| 1955 | 80 |
click to select points on the graph.
number of known chemical elements
\
$$\begin{tikzpicture}
\\begin{axis}
title={number of known chemical elements},
xlabel={year},
ylabel={known elements},
xmin=1800, xmax=2000,
ymin=0, ymax=90,
xtick={1805,1855,1905,1955},
ytick={0,10,20,30,40,50,60,70,80,90},
legend pos=north west,
ymajorgrids=true,
grid style=dashed,
\\addplotmark=*, color=blue coordinates {(1805,20) (1855,40) (1905,60) (1955,80)};
\\end{axis}
\\end{tikzpicture}$$
Step1: Plot 1805 data point
Locate x=1805, y=20 on graph, mark the point.
Step2: Plot 1855 data point
Locate x=1855, y=40 on graph, mark the point.
Step3: Plot 1905 data point
Locate x=1905, y=60 on graph, mark the point.
Step4: Plot 1955 data point
Locate x=1955, y=80 on graph, mark the point.
Step5: Connect plotted points
Draw straight lines between consecutive points.

Snap & solve any problem in the app
Get step-by-step solutions on Sovi AI
Photo-based solutions with guided steps
Explore more problems and detailed explanations
The completed line graph has the following points plotted and connected:
- (1805, 20)
- (1855, 40)
- (1905, 60)
- (1955, 80)