QUESTION IMAGE
Question
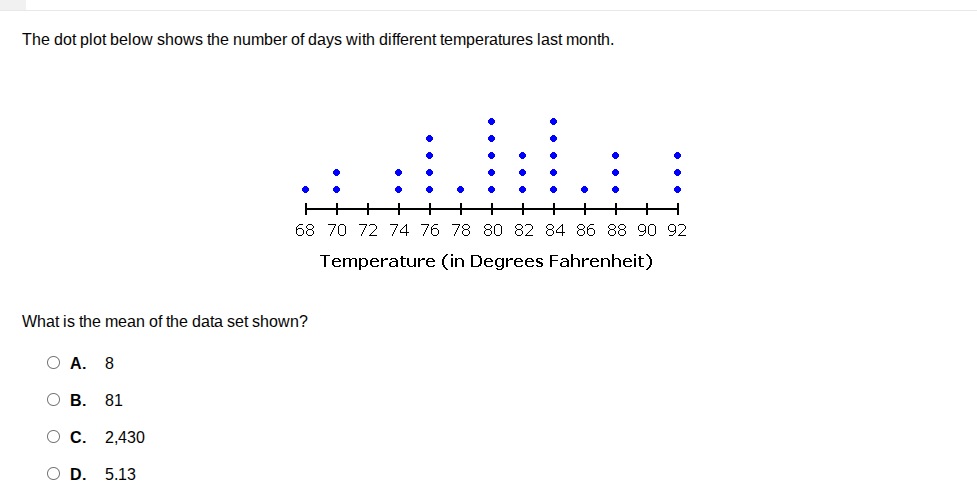
the dot plot below shows the number of days with different temperatures last month.
temperature (in degrees fahrenheit)
what is the mean of the data set shown?
a. 8
b. 81
c. 2,430
d. 5.13
Step1: Count the number of dots for each temperature
- 68: 1 dot
- 70: 2 dots
- 74: 2 dots
- 76: 4 dots
- 78: 1 dot
- 80: 5 dots
- 82: 3 dots
- 84: 5 dots
- 86: 1 dot
- 88: 3 dots
- 92: 3 dots
Step2: Calculate the total sum of (temperature × number of days)
\[
$$\begin{align*}
&68\times1 + 70\times2 + 74\times2 + 76\times4 + 78\times1 + 80\times5 + 82\times3 + 84\times5 + 86\times1 + 88\times3 + 92\times3\\
=& 68 + 140 + 148 + 304 + 78 + 400 + 246 + 420 + 86 + 264 + 276\\
\end{align*}$$
\]
Now sum these values:
\(68+140 = 208\); \(208 + 148=356\); \(356+304 = 660\); \(660+78 = 738\); \(738+400 = 1138\); \(1138+246 = 1384\); \(1384+420 = 1804\); \(1804+86 = 1890\); \(1890+264 = 2154\); \(2154+276 = 2430\)
Step3: Calculate the total number of days (sum of dots)
\(1 + 2+2 + 4+1 + 5+3 + 5+1 + 3+3= 30\)
Step4: Calculate the mean (total sum / total number of days)
Mean \(=\frac{2430}{30}=81\)

Snap & solve any problem in the app
Get step-by-step solutions on Sovi AI
Photo-based solutions with guided steps
Explore more problems and detailed explanations
B. 81