QUESTION IMAGE
Question
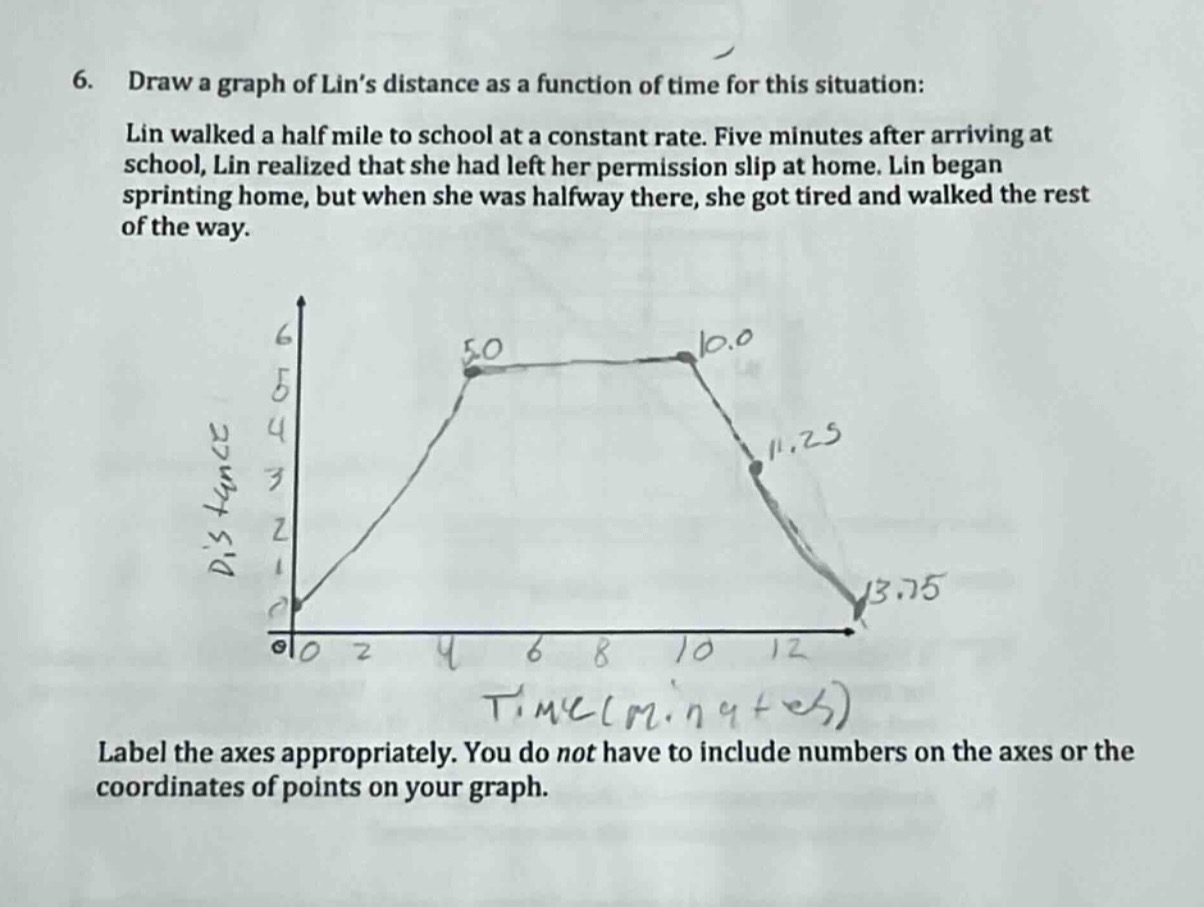
- draw a graph of lins distance as a function of time for this situation: lin walked a half mile to school at a constant rate. five minutes after arriving at school, lin realized that she had left her permission slip at home. lin began sprinting home, but when she was halfway there, she got tired and walked the rest of the way. label the axes appropriately. you do not have to include numbers on the axes or the coordinates of points on your graph.
Step1: Analyze the first segment (walking to school)
Lin walks a half - mile to school at a constant rate. So, on the graph, the distance from home will increase linearly with time until she reaches school. Let the time taken to walk to school be \(t_1\) and the rate be \(r_1=\frac{0.5}{t_1}\) (miles per minute). The graph here is a straight line with a positive slope starting from \((0,0)\) (at time \(t = 0\), distance from home is \(0\)) and ending at \((t_1,0.5)\) (when she reaches school).
Step2: Analyze the second segment (waiting at school)
Five minutes after arriving at school, she realizes she left the slip. So, during these five minutes, her distance from home remains constant (at \(0.5\) miles). So, the graph is a horizontal line from \((t_1,t_1 + 5)\) with \(y\) - value \(0.5\).
Step3: Analyze the third segment (sprinting halfway home)
She starts sprinting home. The distance to home is \(0.5\) miles, so halfway is \(0.25\) miles. Let the time taken to sprint halfway be \(t_2\) and the sprinting rate be \(r_2=\frac{0.25}{t_2}\) (miles per minute). Since she is moving towards home, the distance from home decreases. The graph here is a straight line with a negative slope (steeper than the walking slope, since sprinting is faster) starting from \((t_1 + 5,0.5)\) and ending at \((t_1+5 + t_2,0.25)\).
Step4: Analyze the fourth segment (walking the rest of the way home)
She walks the remaining \(0.25\) miles home. Let the time taken to walk this part be \(t_3\) and the walking rate be \(r_3=\frac{0.25}{t_3}\) (miles per minute). Since \(r_1=\frac{0.5}{t_1}\) and \(r_3=\frac{0.25}{t_3}\), if \(t_1 = 2t_3\) (which is a reasonable assumption as she walks the same speed as before), the slope here will be less steep (in magnitude, since it's negative) than the sprinting slope. The graph is a straight line with a negative slope (less steep than the sprinting slope) starting from \((t_1 + 5+t_2,0.25)\) and ending at \((t_1 + 5+t_2 + t_3,0)\).
To draw the graph:
- Axes: Label the x - axis as "Time (minutes)" and the y - axis as "Distance from Home (miles)".
- First segment: A line with positive slope from \((0,0)\) to \((t_1,0.5)\).
- Second segment: A horizontal line from \((t_1,0.5)\) to \((t_1 + 5,0.5)\).
- Third segment: A line with a negative slope (steeper) from \((t_1 + 5,0.5)\) to \((t_1+5 + t_2,0.25)\).
- Fourth segment: A line with a negative slope (less steep) from \((t_1+5 + t_2,0.25)\) to \((t_1 + 5+t_2 + t_3,0)\).

Snap & solve any problem in the app
Get step-by-step solutions on Sovi AI
Photo-based solutions with guided steps
Explore more problems and detailed explanations
The graph should have four segments: a linear increase (walking to school), a horizontal line (waiting at school), a linear decrease with a steeper slope (sprinting halfway home), and a linear decrease with a less - steep slope (walking the rest of the way home). The x - axis is labeled "Time (minutes)" and the y - axis is labeled "Distance from Home (miles)".