QUESTION IMAGE
Question
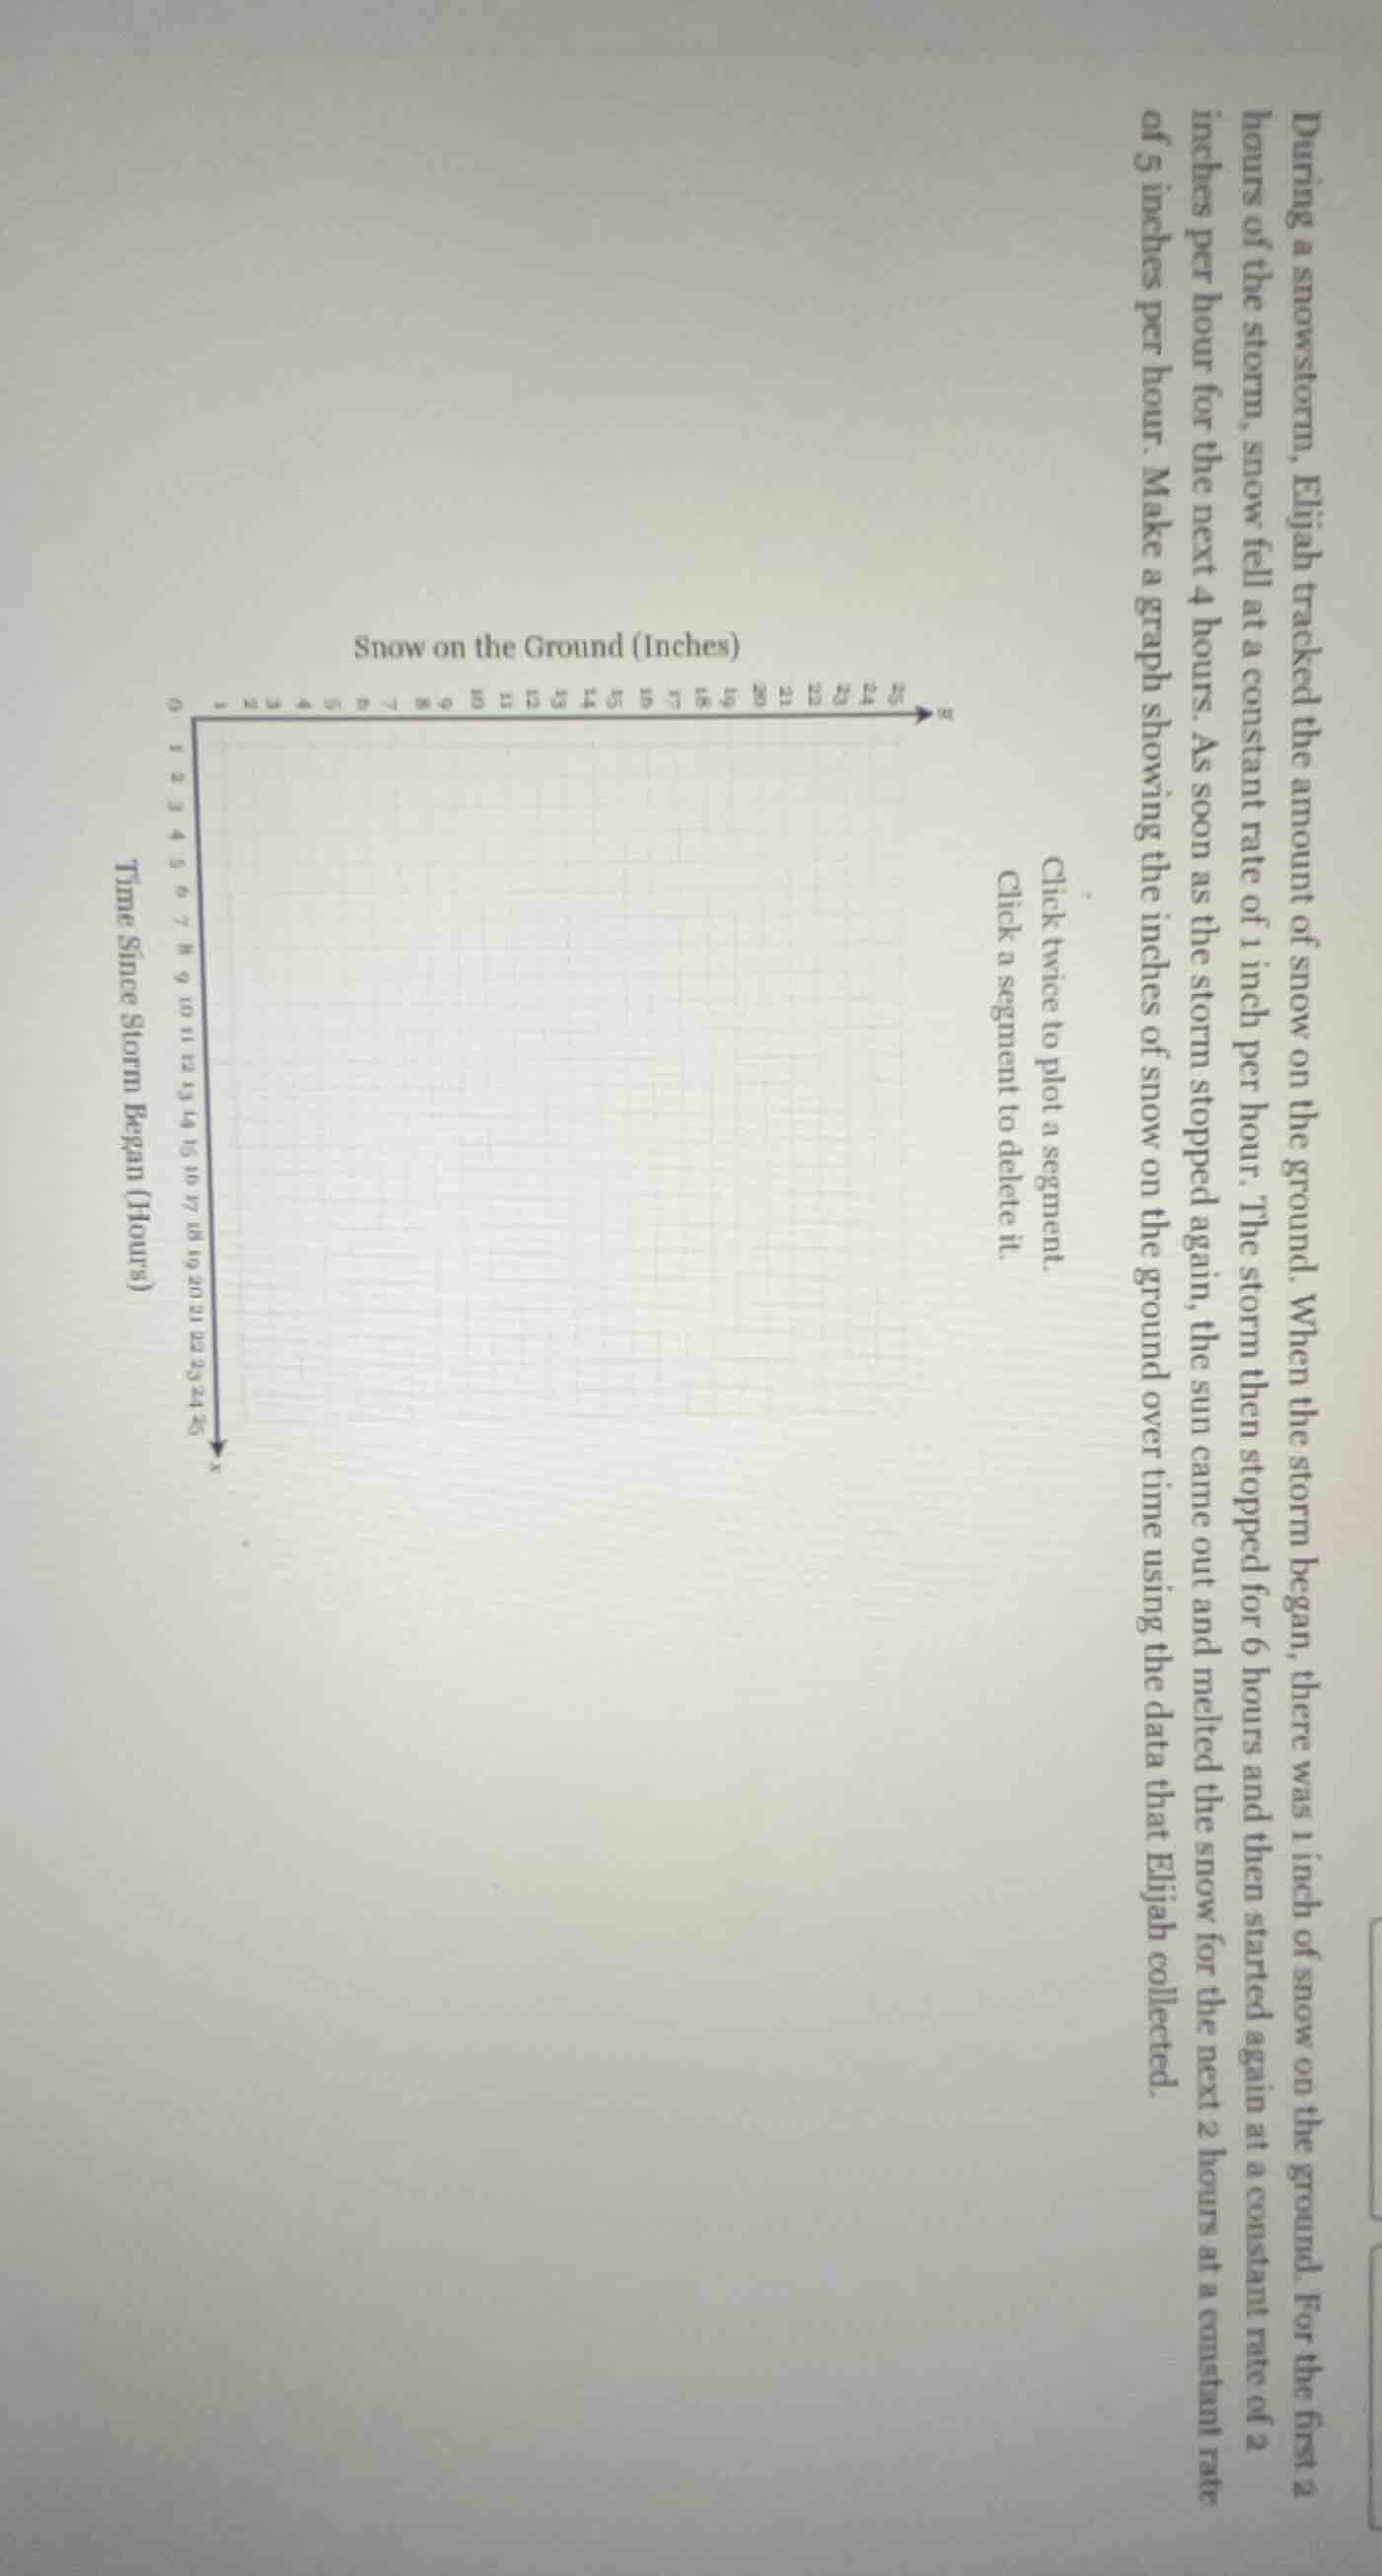
during a snowstorm, elijah tracked the amount of snow on the ground. when the storm began, there was 1 inch of snow on the ground. for the first 2 hours of the storm, snow fell at a constant rate of 1 inch per hour. the storm then stopped for 6 hours and then started again at a constant rate of 2 inches per hour for the next 4 hours. as soon as the storm stopped again, the sun came out and melted the snow for the next 2 hours at a constant rate of 5 inches per hour. make a graph showing the inches of snow on the ground over time using the data that elijah collected.
click twice to plot a segment.
click a segment to delete it.
snow on the ground (inches)
time since storm began (hours)
Step1: Start point setup
Initial state: At $x=0$ (storm begins), $y=1$ inch.
Step2: First 2 hours snowfall
Snow increases by 1 in/hour.
Total snow: $1 + (1 \times 2) = 3$ inches.
Segment from $(0,1)$ to $(2,3)$.
Step3: 6 hours of no snow
Snow amount stays constant at 3 inches.
Segment from $(2,3)$ to $(8,3)$.
Step4: Next 4 hours snowfall
Snow increases by 2 in/hour.
Total snow: $3 + (2 \times 4) = 11$ inches.
Segment from $(8,3)$ to $(12,11)$.
Step5: Final 2 hours melting
Snow decreases by 5 in/hour.
Total snow: $11 - (5 \times 2) = 1$ inch.
Segment from $(12,11)$ to $(14,1)$.

Snap & solve any problem in the app
Get step-by-step solutions on Sovi AI
Photo-based solutions with guided steps
Explore more problems and detailed explanations
The graph consists of 4 connected line segments:
- From $(0, 1)$ to $(2, 3)$
- From $(2, 3)$ to $(8, 3)$
- From $(8, 3)$ to $(12, 11)$
- From $(12, 11)$ to $(14, 1)$