QUESTION IMAGE
Question
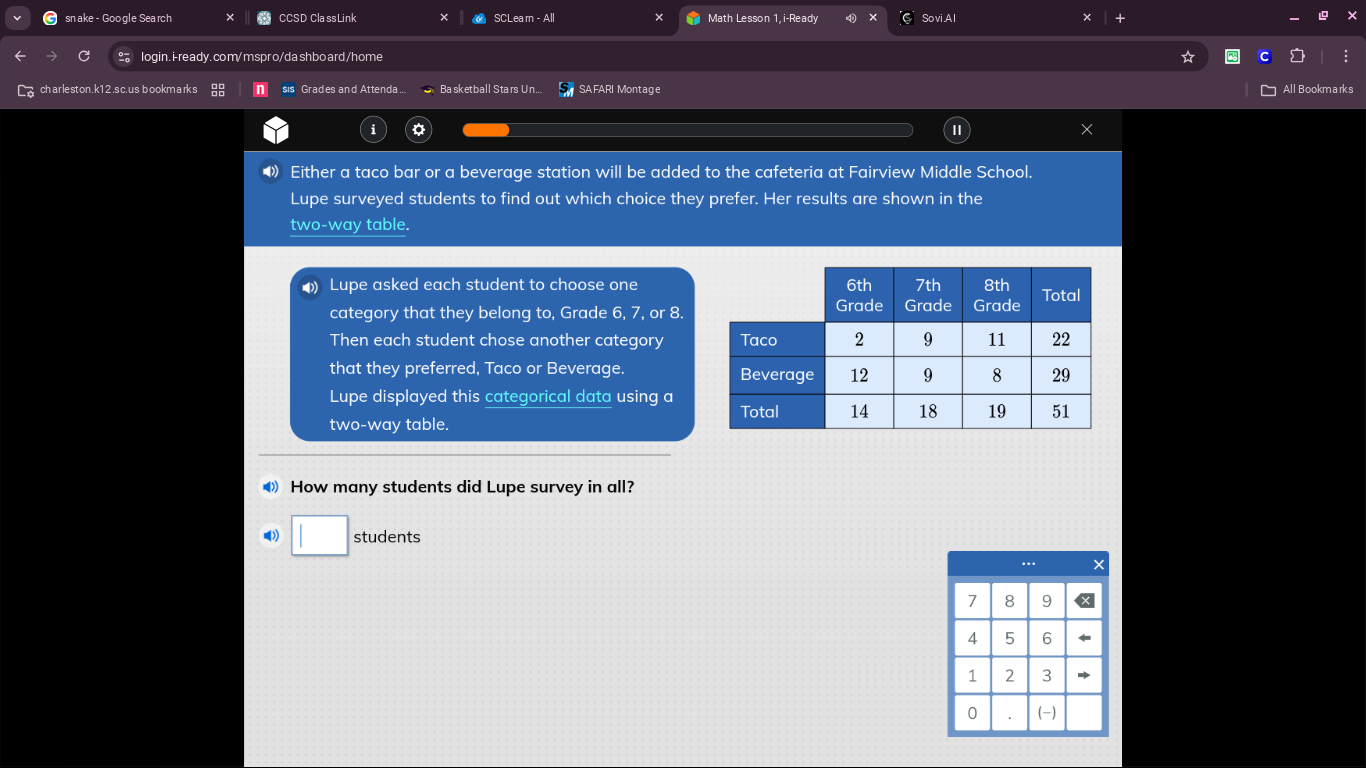
either a taco bar or a beverage station will be added to the cafeteria at fairview middle school.
lupe surveyed students to find out which choice they prefer. her results are shown in the two-way table.
lupe asked each student to choose one category that they belong to, grade 6, 7, or 8.
then each student chose another category that they preferred, taco or beverage.
lupe displayed this categorical data using a two-way table.
| 6th grade | 7th grade | 8th grade | total | |
|---|---|---|---|---|
| beverage | 12 | 9 | 8 | 29 |
| total | 14 | 18 | 19 | 51 |
how many students did lupe survey in all?
_____ students
Step1: Locate total survey count
In a two-way table, the bottom-right cell shows the total number of respondents, which is the sum of all surveyed students.
<Expression>
From the table, the total value is $\boldsymbol{51}$
</Expression>

Snap & solve any problem in the app
Get step-by-step solutions on Sovi AI
Photo-based solutions with guided steps
Explore more problems and detailed explanations
51 students