QUESTION IMAGE
Question
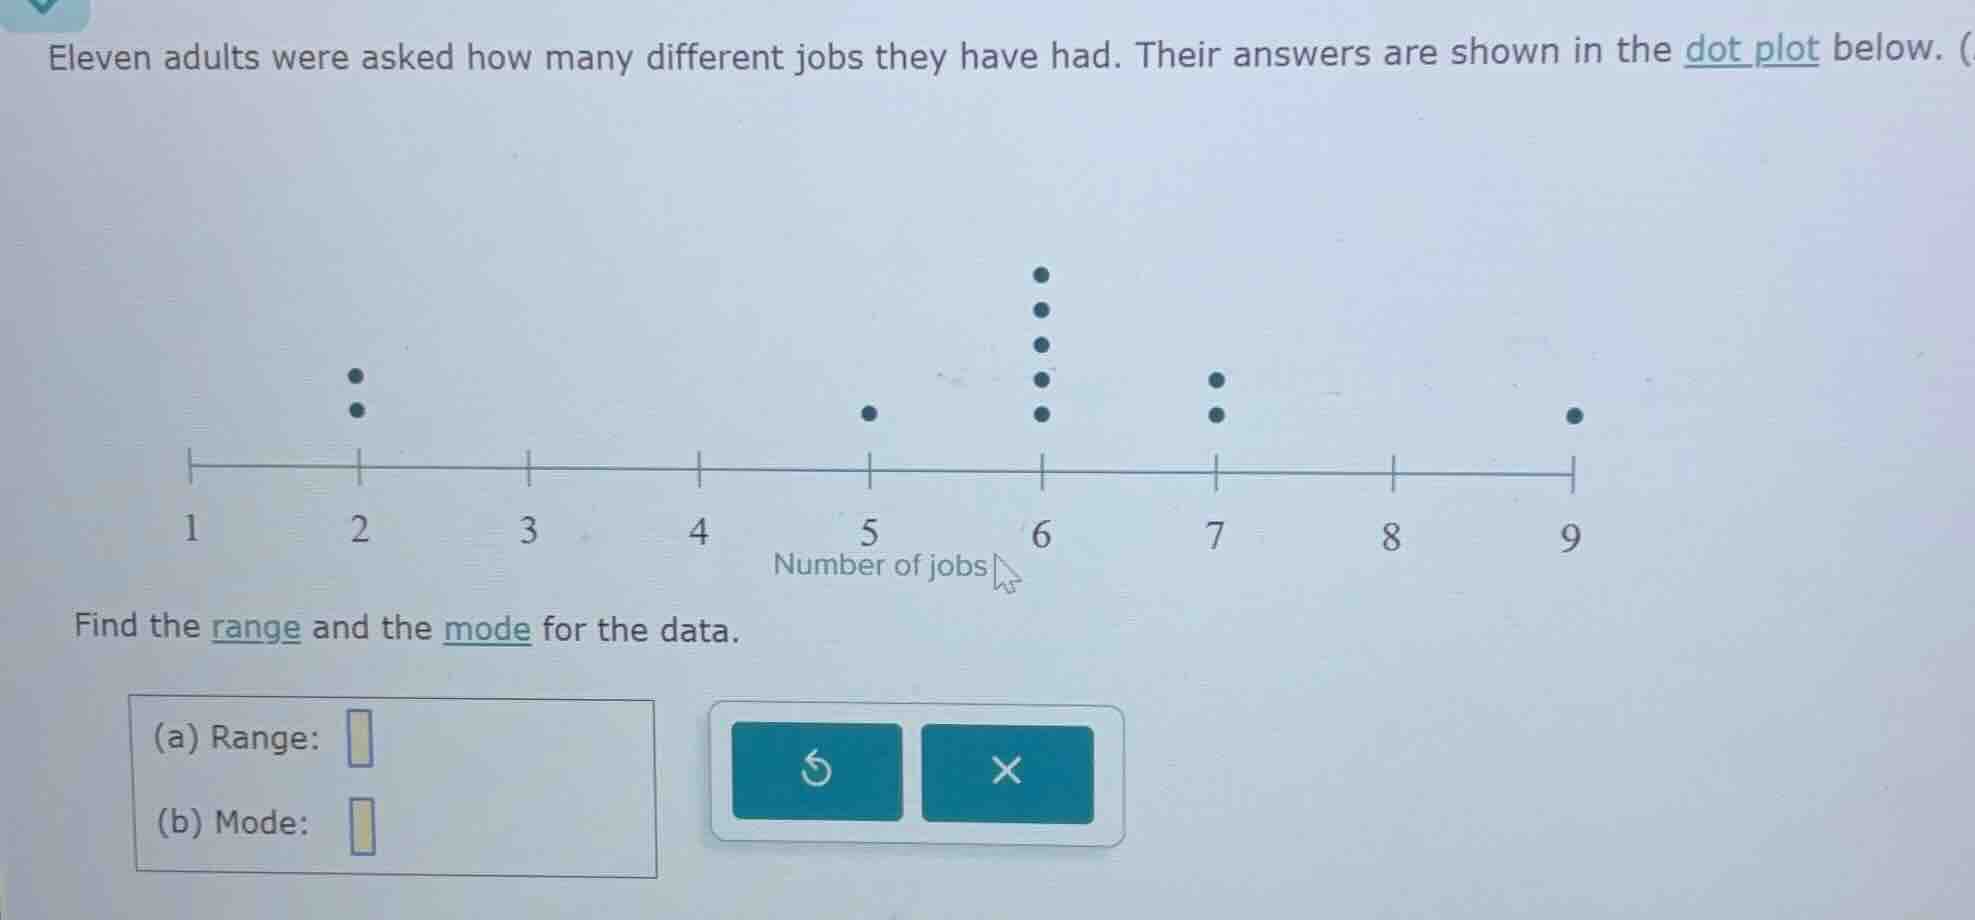
eleven adults were asked how many different jobs they have had. their answers are shown in the dot plot below. find the range and the mode for the data. (a) range: (b) mode:
Step1: Find the range
The range is calculated as the maximum value minus the minimum value. From the dot plot, the minimum number of jobs is 2 and the maximum is 9.
So, range = \( 9 - 2 = 7 \)
Step2: Find the mode
The mode is the value that appears most frequently. Looking at the dot plot, the value 6 has the most dots (the highest frequency).

Snap & solve any problem in the app
Get step-by-step solutions on Sovi AI
Photo-based solutions with guided steps
Explore more problems and detailed explanations
(a) Range: \( 7 \)
(b) Mode: \( 6 \)